ASP.NET Core: Metrics

In this post, I add some metrics to ASP.NET Core application. We’ll discuss why monitoring is so important and how we can deal with it.
Monitoring
Monitoring is one of the methods to understand what is happening with your application in production. As I said in the previous post, we use logging for similar purposes. What is the difference between monitoring and logging? Metrics are all almost about numbers, on the other hand, logs are all almost about a text. With the monitoring, you collect a lot of data, but you don’t read it, you just control that the measurements are within acceptable limits. Logging, contrariwise, is very useful in situations when you need to know what exactly happened, you can read stack trace, some useful messages, variable values. Of course, you can understand, for example, the amount of exceptions with your logs, but monitoring is more essential for these purposes.
In this article, I’ll mostly write about Prometheus and Grafana, but there are more useful tools here, and you can choose which of that more appropriate for you. Firstly, I need to mention the TICK stack (Telegraf, InfluxDB, Chronograf, Kapacitor), it is a very powerful alternative to Prometheus and Grafana. Secondly, there is a library App Metrics, that allows you to collect metrics from your .NET application and export them to a database, for example, Prometheus, InfluxDB, Elacticsearch. I won’t consider these solutions, because I don’t have enough experience with them.
I’ve created a github repository for this article.
Prometheus-net
To start with, let’s collect some metrics. You need to add this library and modify your Startup class.
public class Startup
{
    public void ConfigureServices(IServiceCollection services)
    {
        services.AddControllers();
    }

    public void Configure(IApplicationBuilder app, IWebHostEnvironment env)
    {
        app.UseMetricServer();
        app.UseHttpMetrics();

        app.UseRouting();

        app.UseEndpoints(endpoints =>
        {
            endpoints.MapControllers();
        });
    }
}
And that’s all, go to /metrics and you’ll see some default measurements.
# HELP process_virtual_memory_bytes Virtual memory size in bytes.
# TYPE process_virtual_memory_bytes gauge
process_virtual_memory_bytes 23081852928
# HELP dotnet_collection_count_total GC collection count
# TYPE dotnet_collection_count_total counter
dotnet_collection_count_total{generation="0"} 0
dotnet_collection_count_total{generation="1"} 0
dotnet_collection_count_total{generation="2"} 0
# HELP dotnet_total_memory_bytes Total known allocated memory
# TYPE dotnet_total_memory_bytes gauge
dotnet_total_memory_bytes 1571080
# HELP http_requests_received_total Provides the count of HTTP requests that have been processed by the ASP.NET Core pipeline.
# TYPE http_requests_received_total counter
# HELP http_request_duration_seconds The duration of HTTP requests processed by an ASP.NET Core application.
# TYPE http_request_duration_seconds histogram
# HELP process_num_threads Total number of threads
# TYPE process_num_threads gauge
process_num_threads 23
# HELP process_cpu_seconds_total Total user and system CPU time spent in seconds.
# TYPE process_cpu_seconds_total counter
process_cpu_seconds_total 0.75
# HELP process_open_handles Number of open handles
# TYPE process_open_handles gauge
process_open_handles 135
# HELP process_private_memory_bytes Process private memory size
# TYPE process_private_memory_bytes gauge
process_private_memory_bytes 0
# HELP http_requests_in_progress The number of requests currently in progress in the ASP.NET Core pipeline.
# TYPE http_requests_in_progress gauge
http_requests_in_progress 0
# HELP process_working_set_bytes Process working set
# TYPE process_working_set_bytes gauge
process_working_set_bytes 60121088
# HELP process_start_time_seconds Start time of the process since unix epoch in seconds.
# TYPE process_start_time_seconds gauge
process_start_time_seconds 1571570609.4199998
Prometheus
Of course, it is very inconvenient to see such information in a text form. We want to use a tool, which will keep that data, aggregate and create some plots. As I mentioned early, we’ll use Prometheus for these purposes.
As always, I’ll start everything in Docker containers because it’s fast and simple. Here I prepared a docker-compose script.
version: '3.4'

services:
  api:
    build: .
    container_name: api
    ports:
      - "5000:80"
    depends_on:
      - prometheus

  prometheus:
    image: prom/prometheus
    ports:
      - "9090:9090"
    volumes:
      - ./prometheus/prometheus.yml:/etc/prometheus/prometheus.yml
Besides, you need to add this configuration file.
scrape_configs:
  - job_name: api
    metrics_path: /metrics
    static_configs:
      - targets: ['api:80']
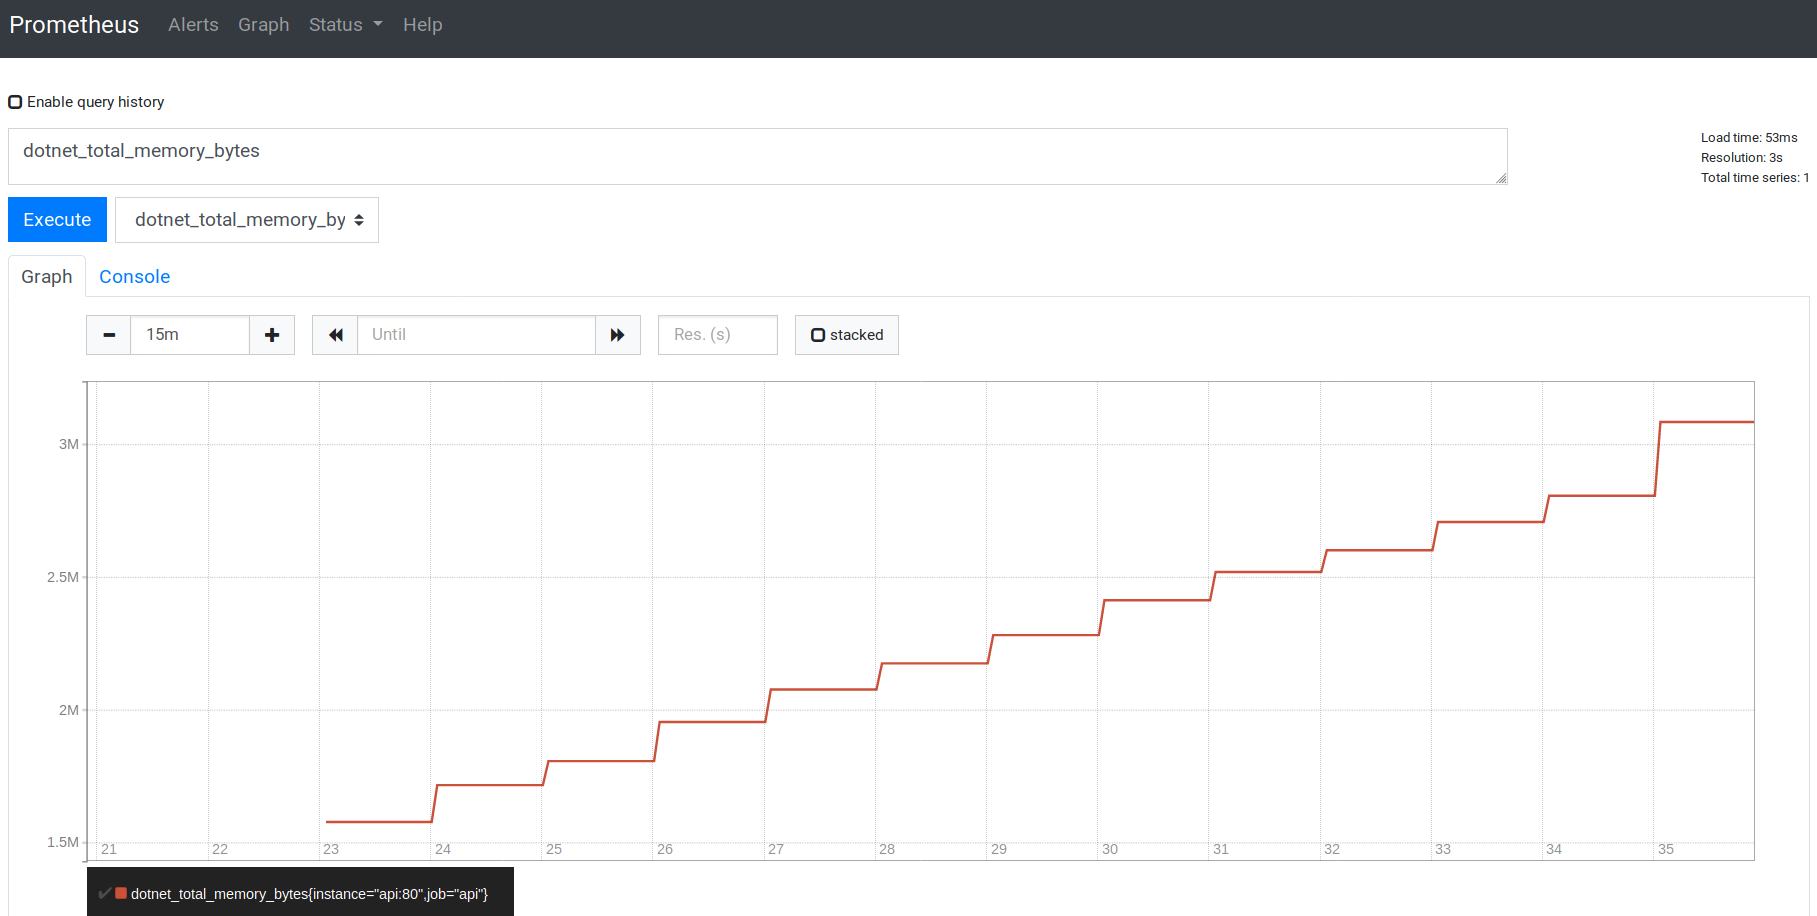
When all preparations are finished, go to the http://localhost:9090/.
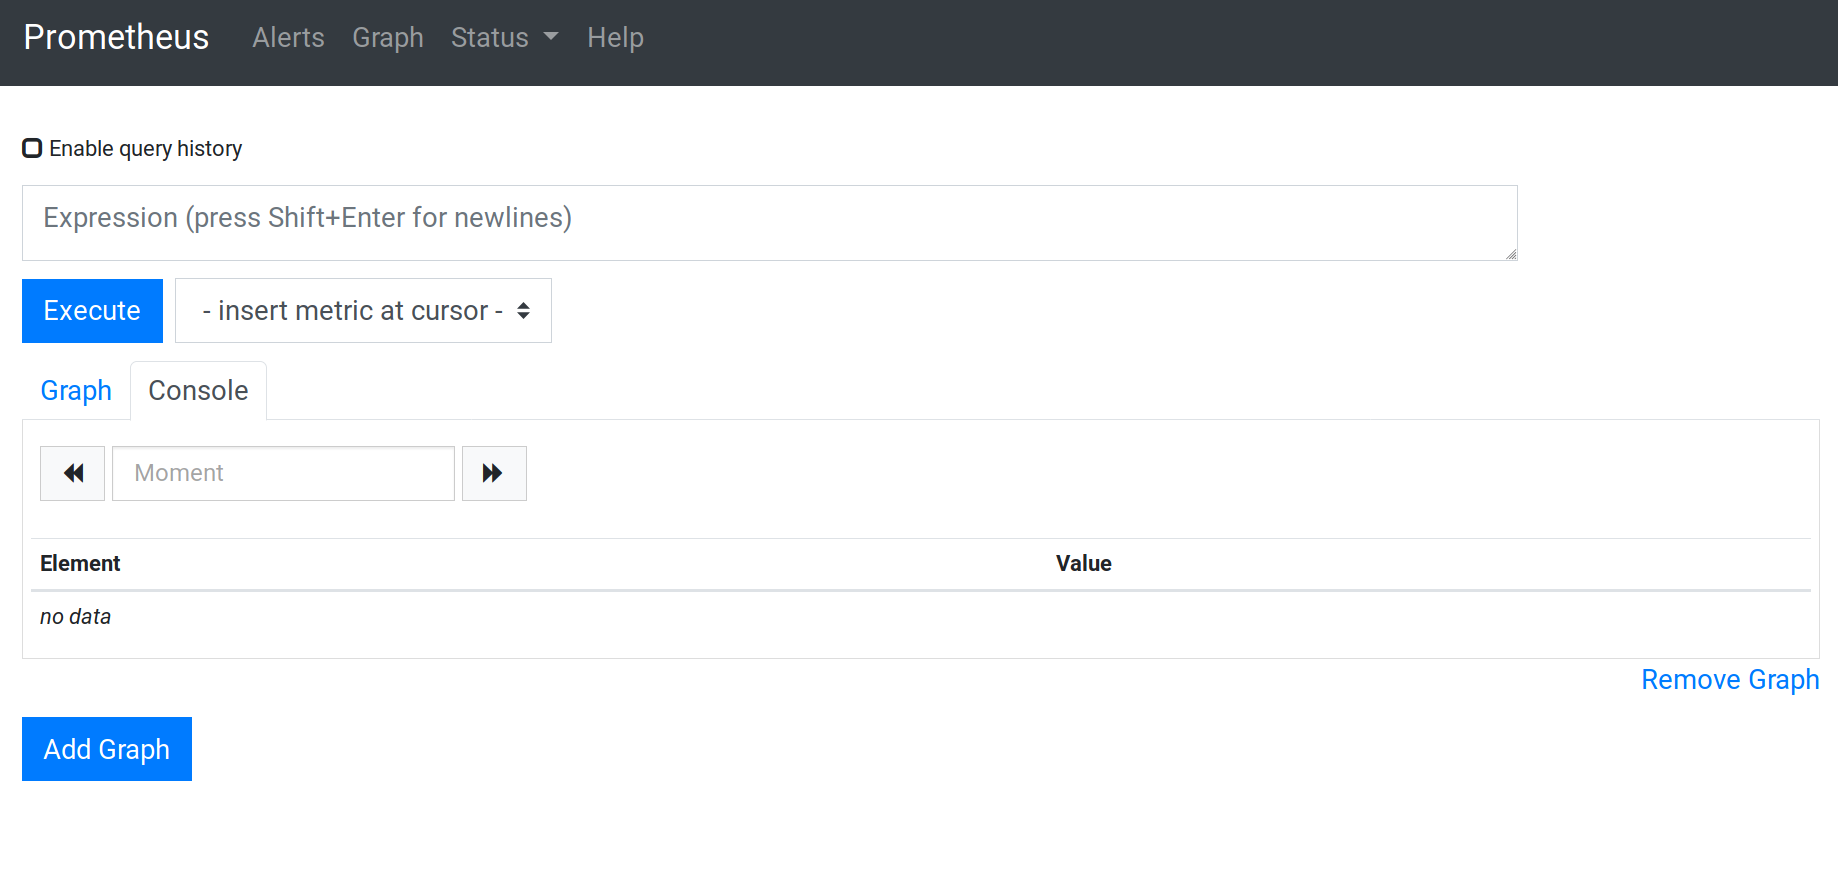
In this interface you can create different charts, but, for honest, it is not a super convenient interface.
Grafana
Grafana is a solution, that allows you to visualize metrics from various data storages. This is a docker-compose script to run them all.
version: '3.4'

services:
  api:
    build: .
    container_name: api
    ports:
      - "5000:80"
    depends_on:
      - prometheus
      - grafana

  prometheus:
    image: prom/prometheus
    ports:
      - "9090:9090"
    volumes:
      - ./prometheus/prometheus.yml:/etc/prometheus/prometheus.yml

  grafana:
    image: grafana/grafana
    ports:
      - "3000:3000"
    depends_on:
      - prometheus
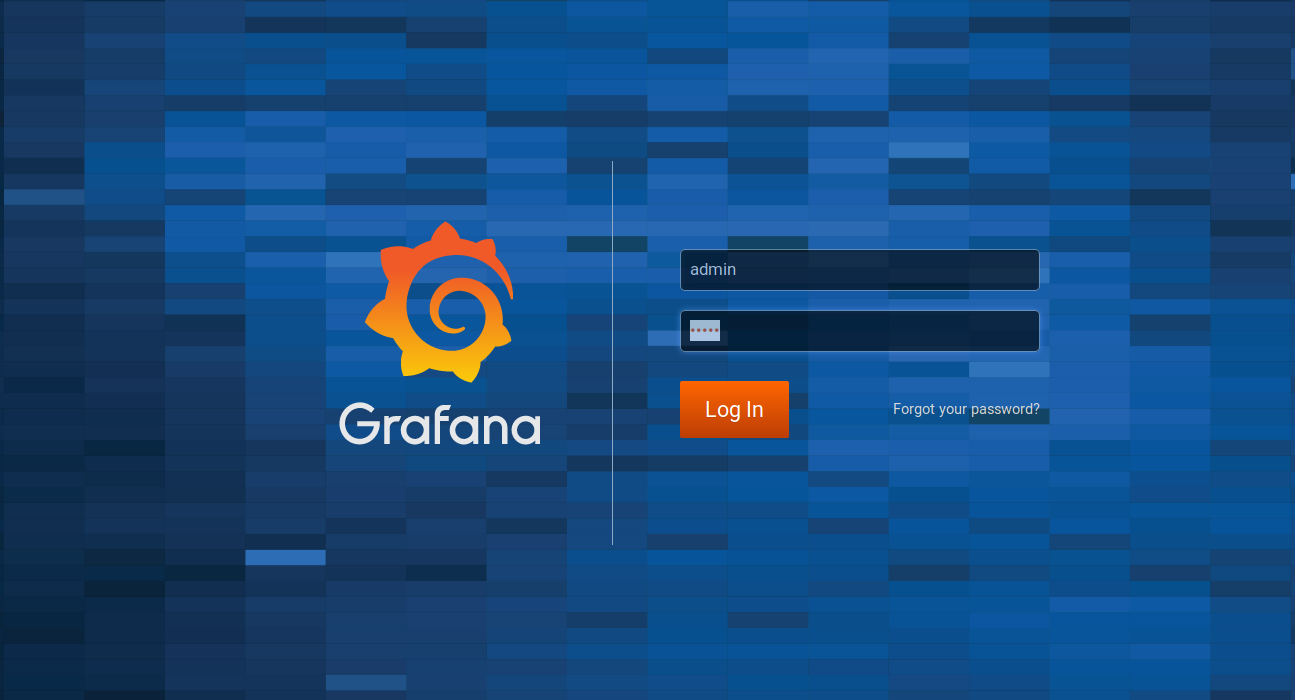
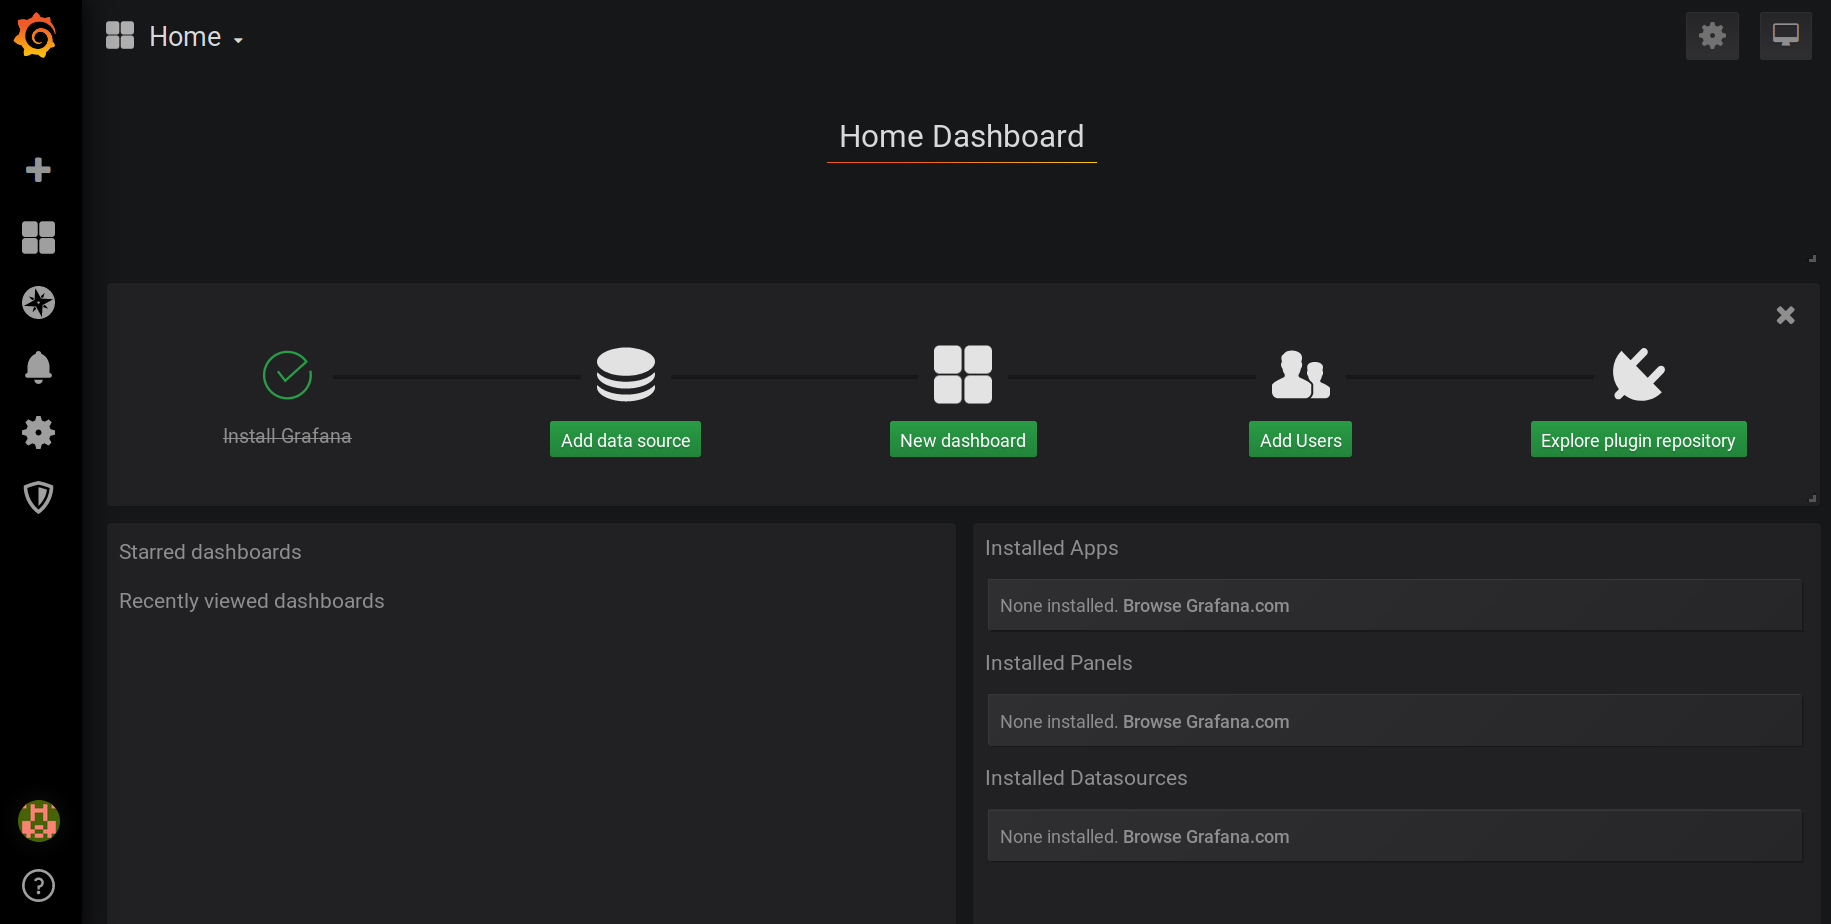
Go to http://localhost:3000/ and you’ll see the login page. The default username and password is admin and admin.
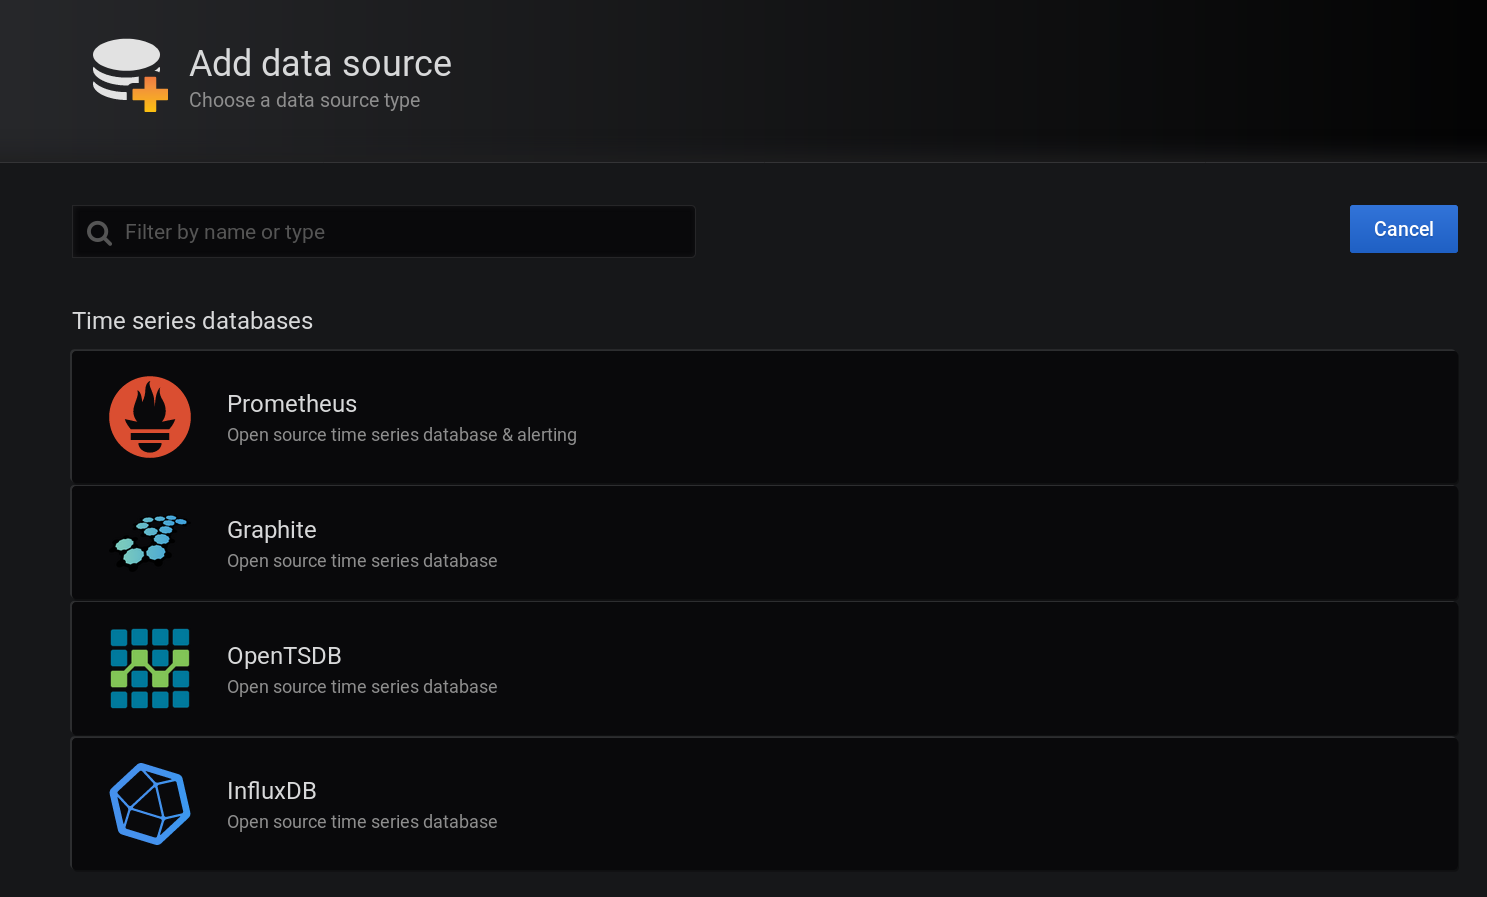
On the next page add a new data source.
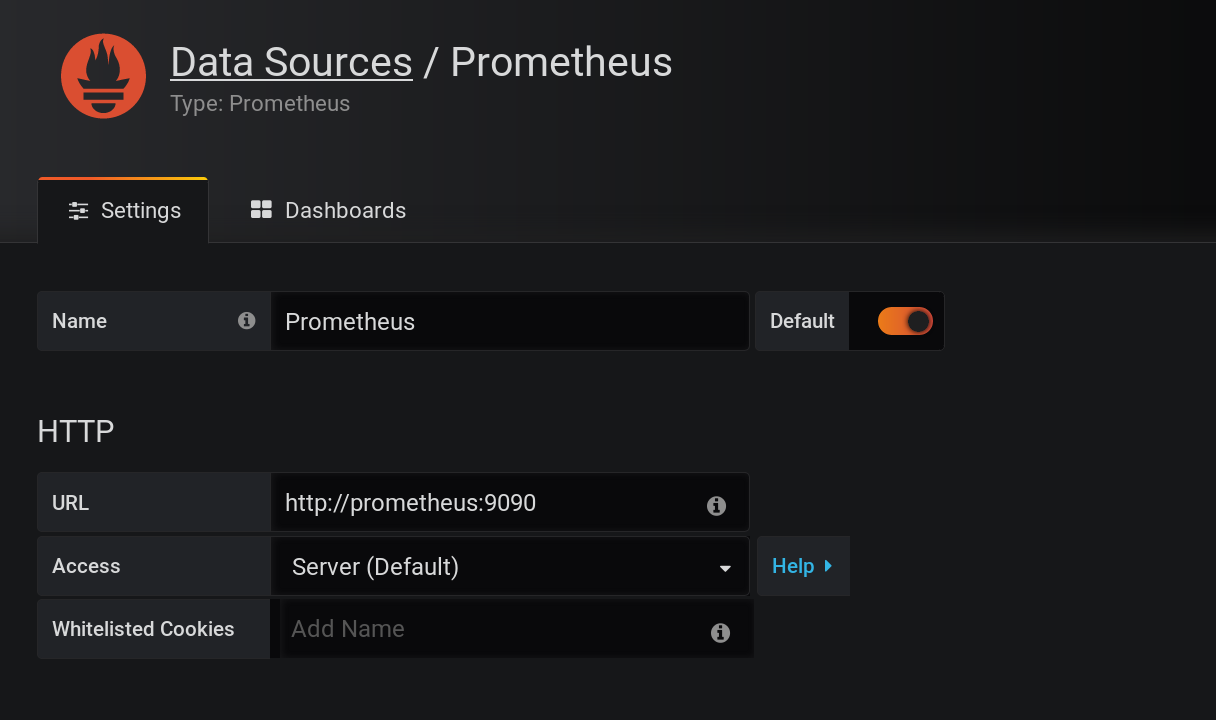
Choose Prometheus and set url http://prometheus:9090.
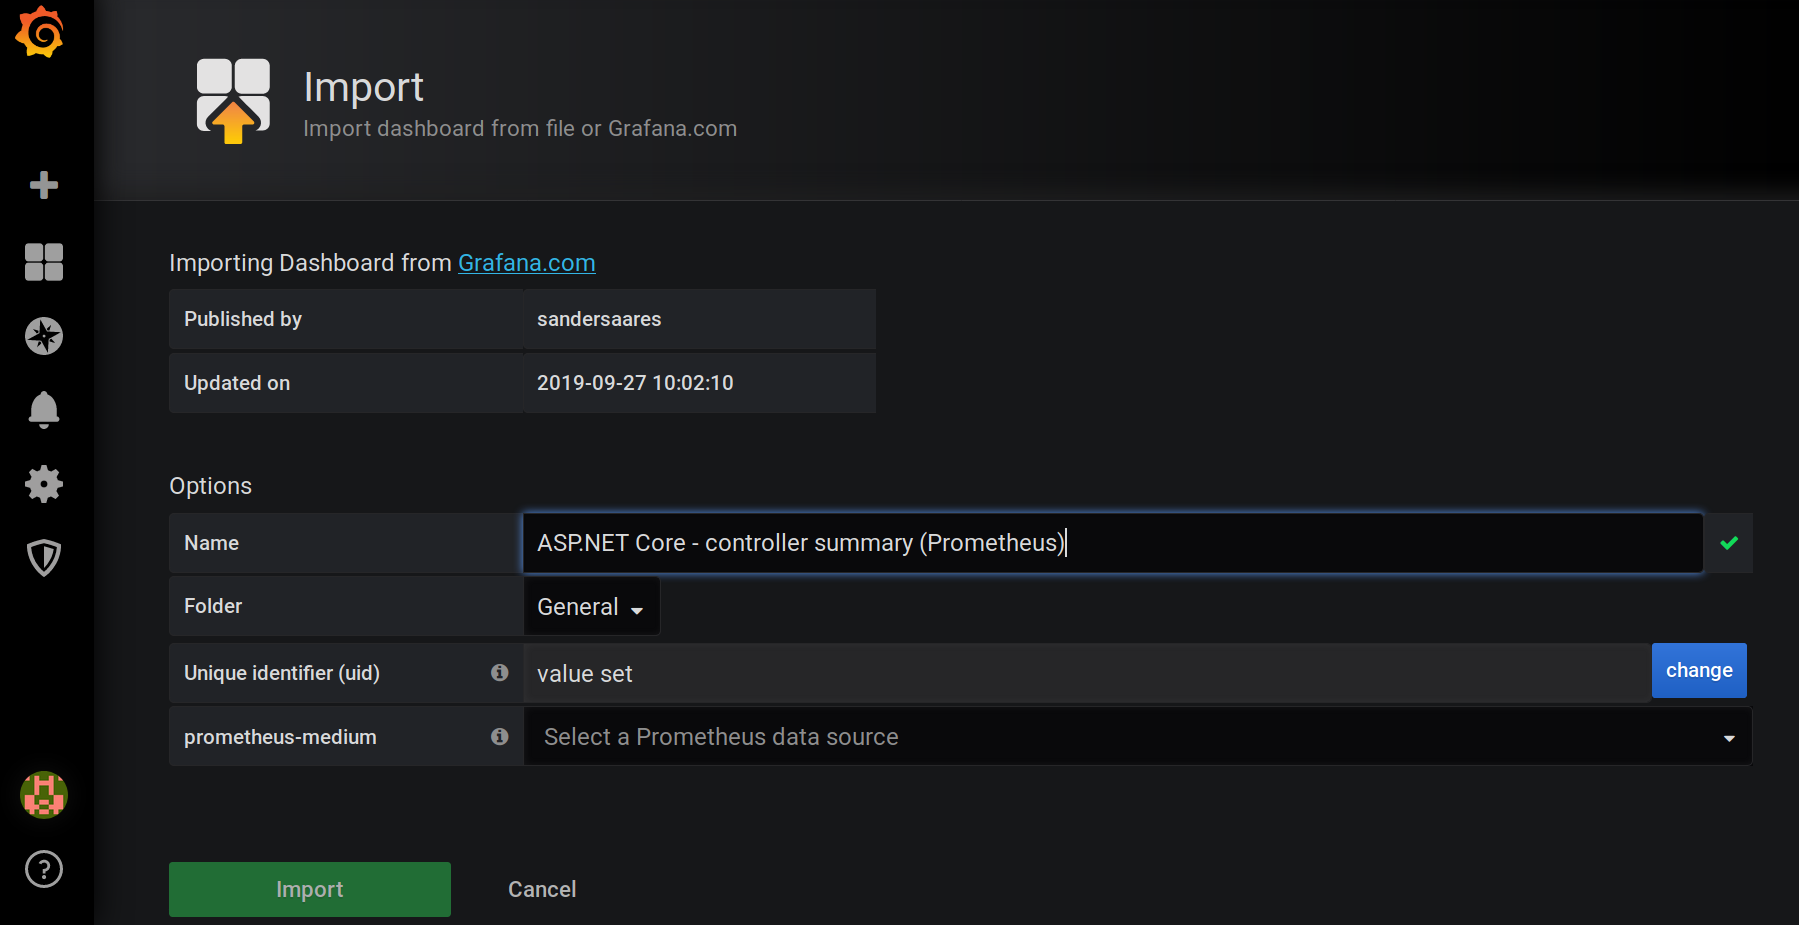
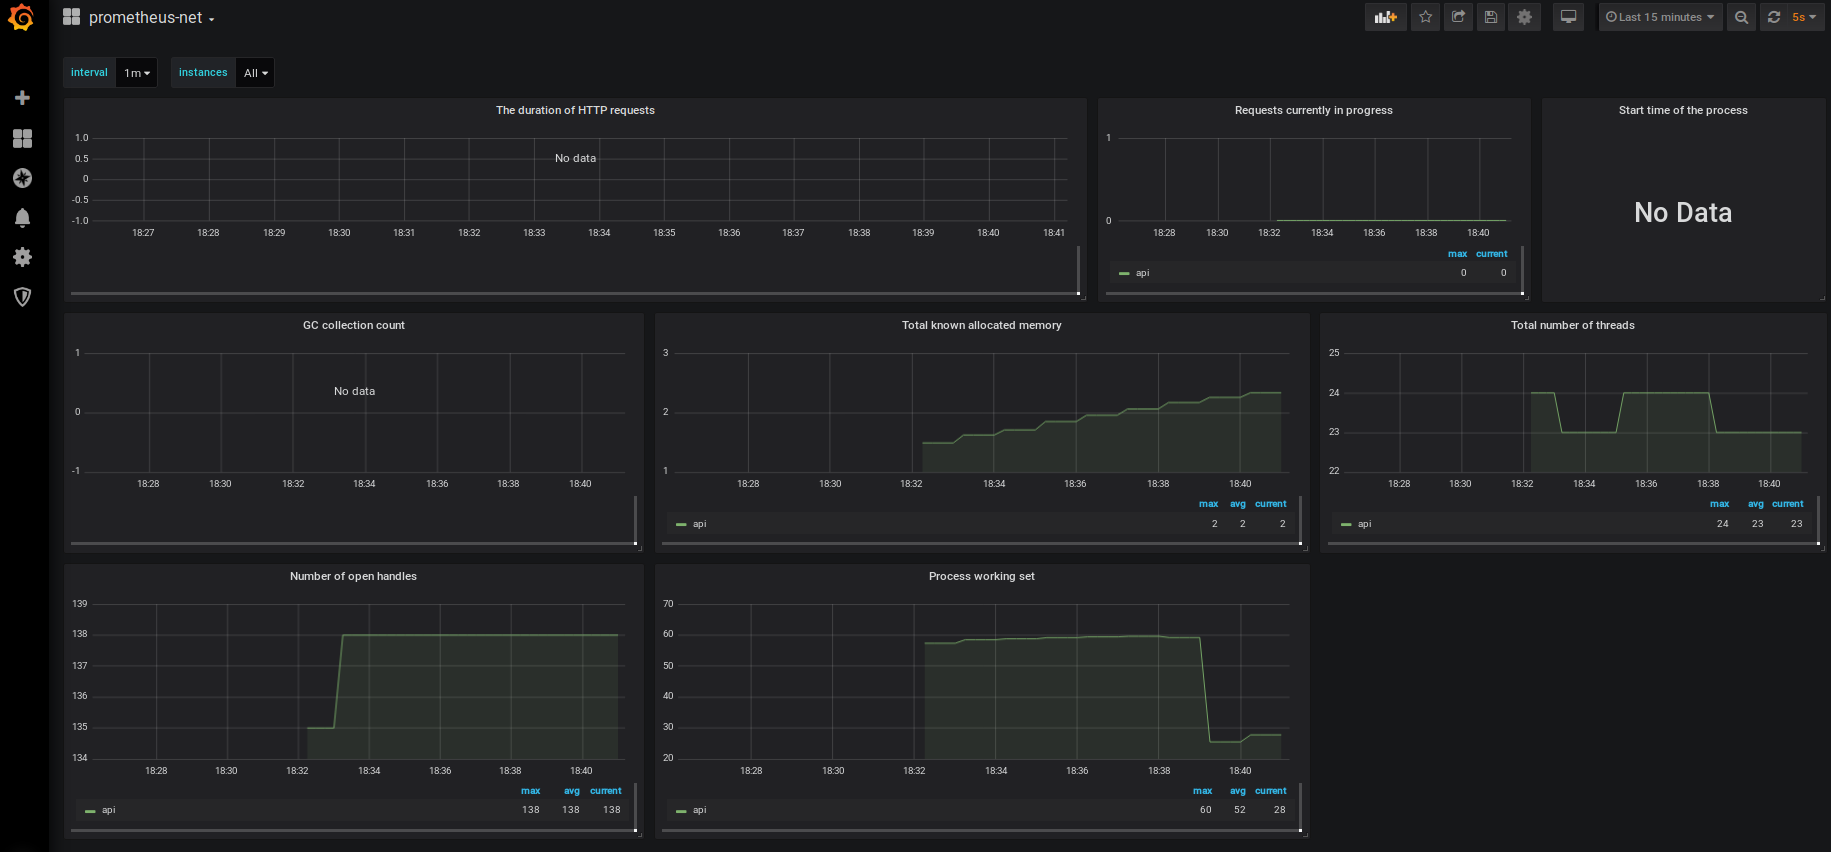
After that, you need to import dashboards for your data. You can create your own, but there are two templates for prometheus-net library. Click + -> Import and paste dashboard id (10427 or 10915).
Set parameters and data source.
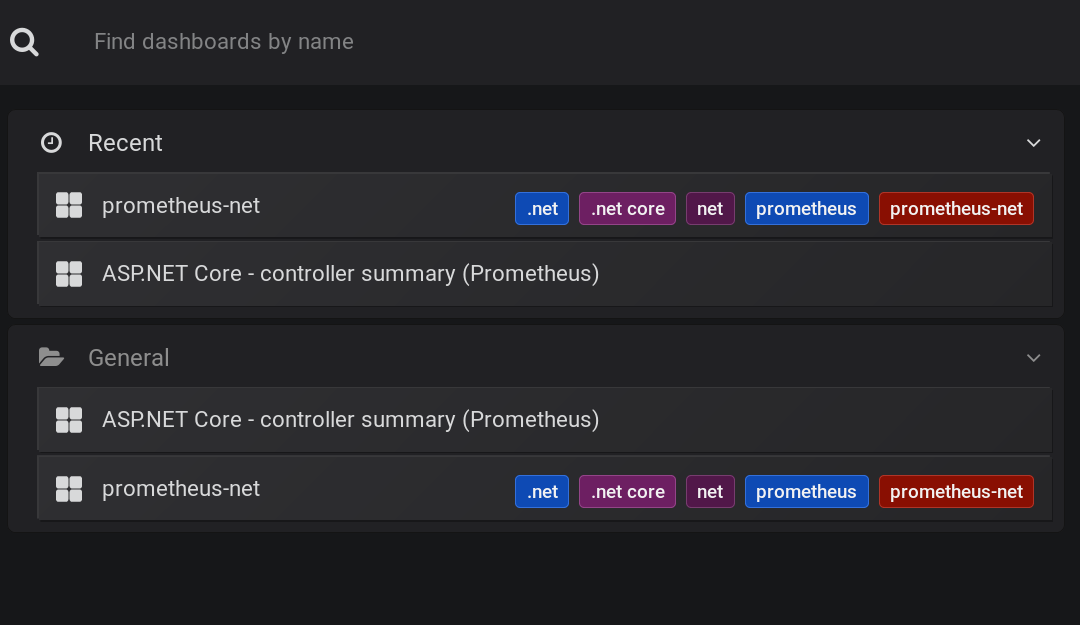
Now you have two dashboards and beautiful charts.
Business Metrics
Sometimes you want to monitor your own metrics, for example, a number of visitors per hour. In this section, we’ll consider how to create a custom measurement.
First of all, there are four metric types in Prometheus: counter, gauge, histogram and summary. I won’t dive into differences between them, because it is well explained in the docs. We’ll use a histogram.
Histograms track the size and number of events in buckets. This allows for aggregatable calculation of quantiles.
Let’s modify the default weather controller.
[ApiController]
[Route("[controller]")]
public class WeatherForecastController : ControllerBase
{
    private static readonly string[] Summaries = new[]
    {
        "Freezing", "Bracing", "Chilly", "Cool", "Mild", "Warm", "Balmy", "Hot", "Sweltering", "Scorching"
    };

    private readonly ILogger<WeatherForecastController> _logger;

    public WeatherForecastController(ILogger<WeatherForecastController> logger)
    {
        _logger = logger;
    }

    [HttpGet]
    public WeatherForecast Get()
    {
        var rng = new Random();
        var forecast = new WeatherForecast
        {
            Date = DateTime.Now.AddDays(1),
            TemperatureC = rng.Next(-20, 30),
            Summary = Summaries[rng.Next(Summaries.Length)]
        };

        var histogram = Metrics.CreateHistogram(
            "temperature_with_summary",
            "Temperature buckets divided by summary",
            new HistogramConfiguration
            {
                LabelNames = new []{"Summary"},
                Buckets = Histogram.LinearBuckets(-20, 10, 6)
            }
        );
        histogram
            .WithLabels(forecast.Summary)
            .Observe(forecast.TemperatureC);

        return forecast;
    }
}
I’ve created a histogram with the name temperature_with_summary and six buckets. Also, I’ve put a label of weather type.
Now, go to Grafana and create a new dashboard.
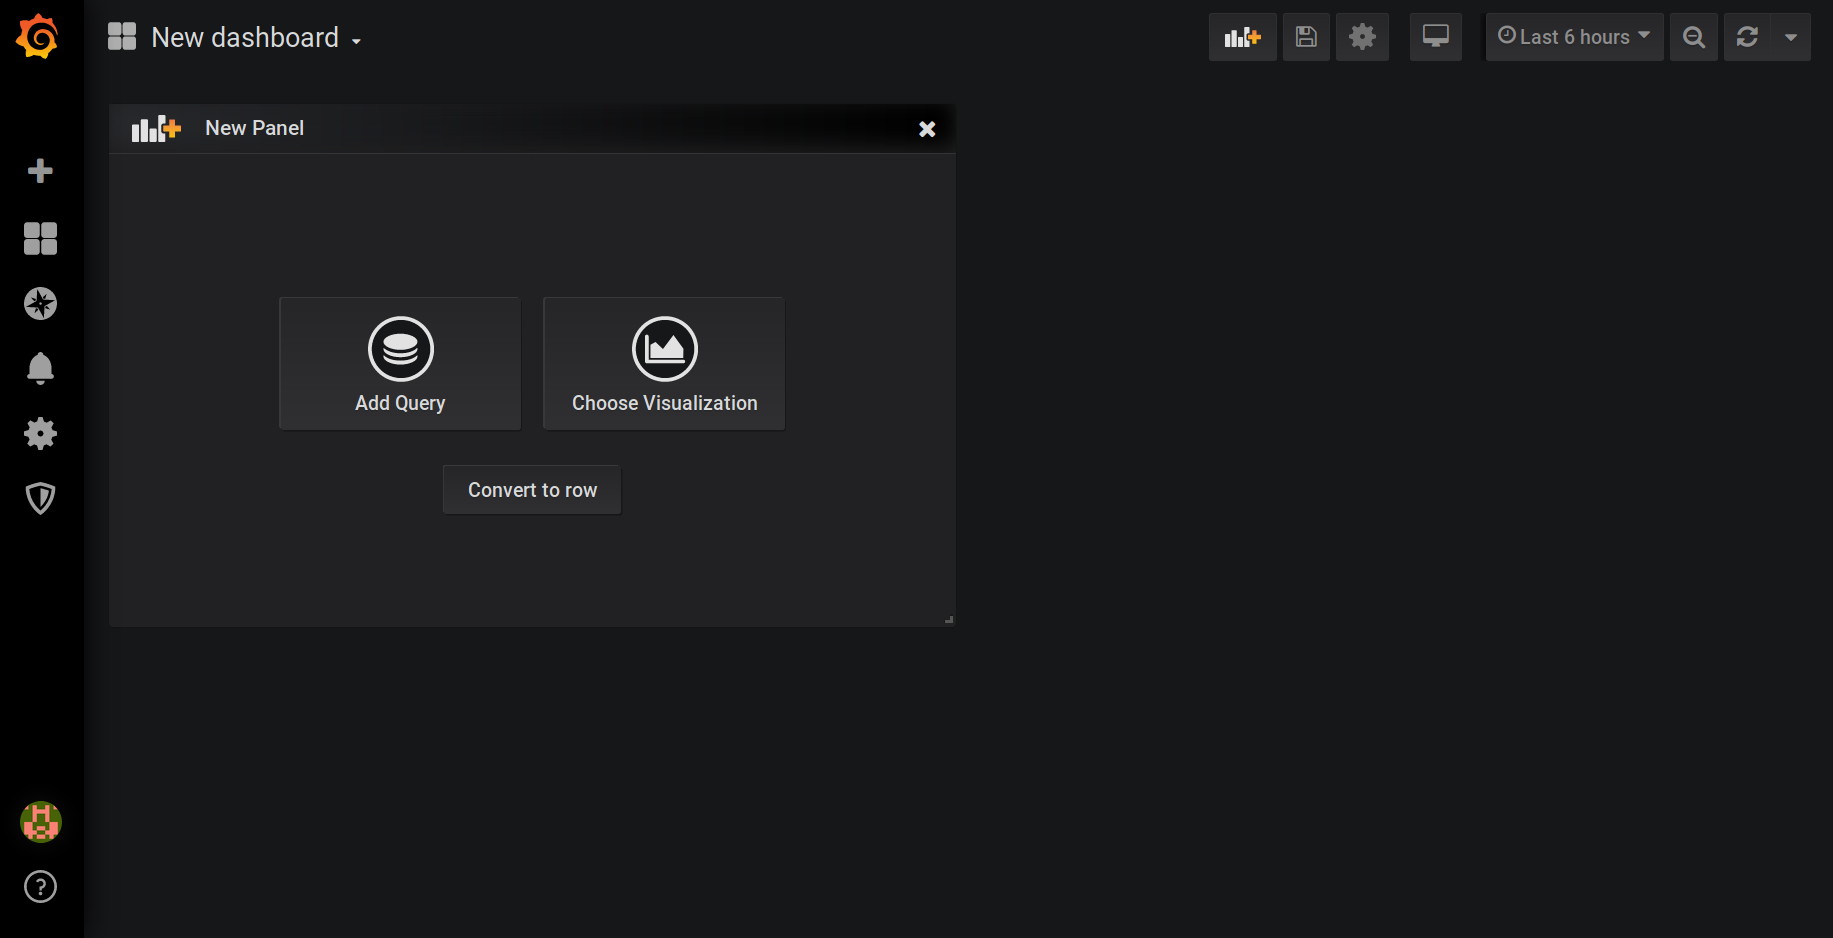
You can specify a query, different parameters, a graph. I’ve used a formula temperature_with_summary_sum/temperature_with_summary_count to calculate an average temperature for different weather types.
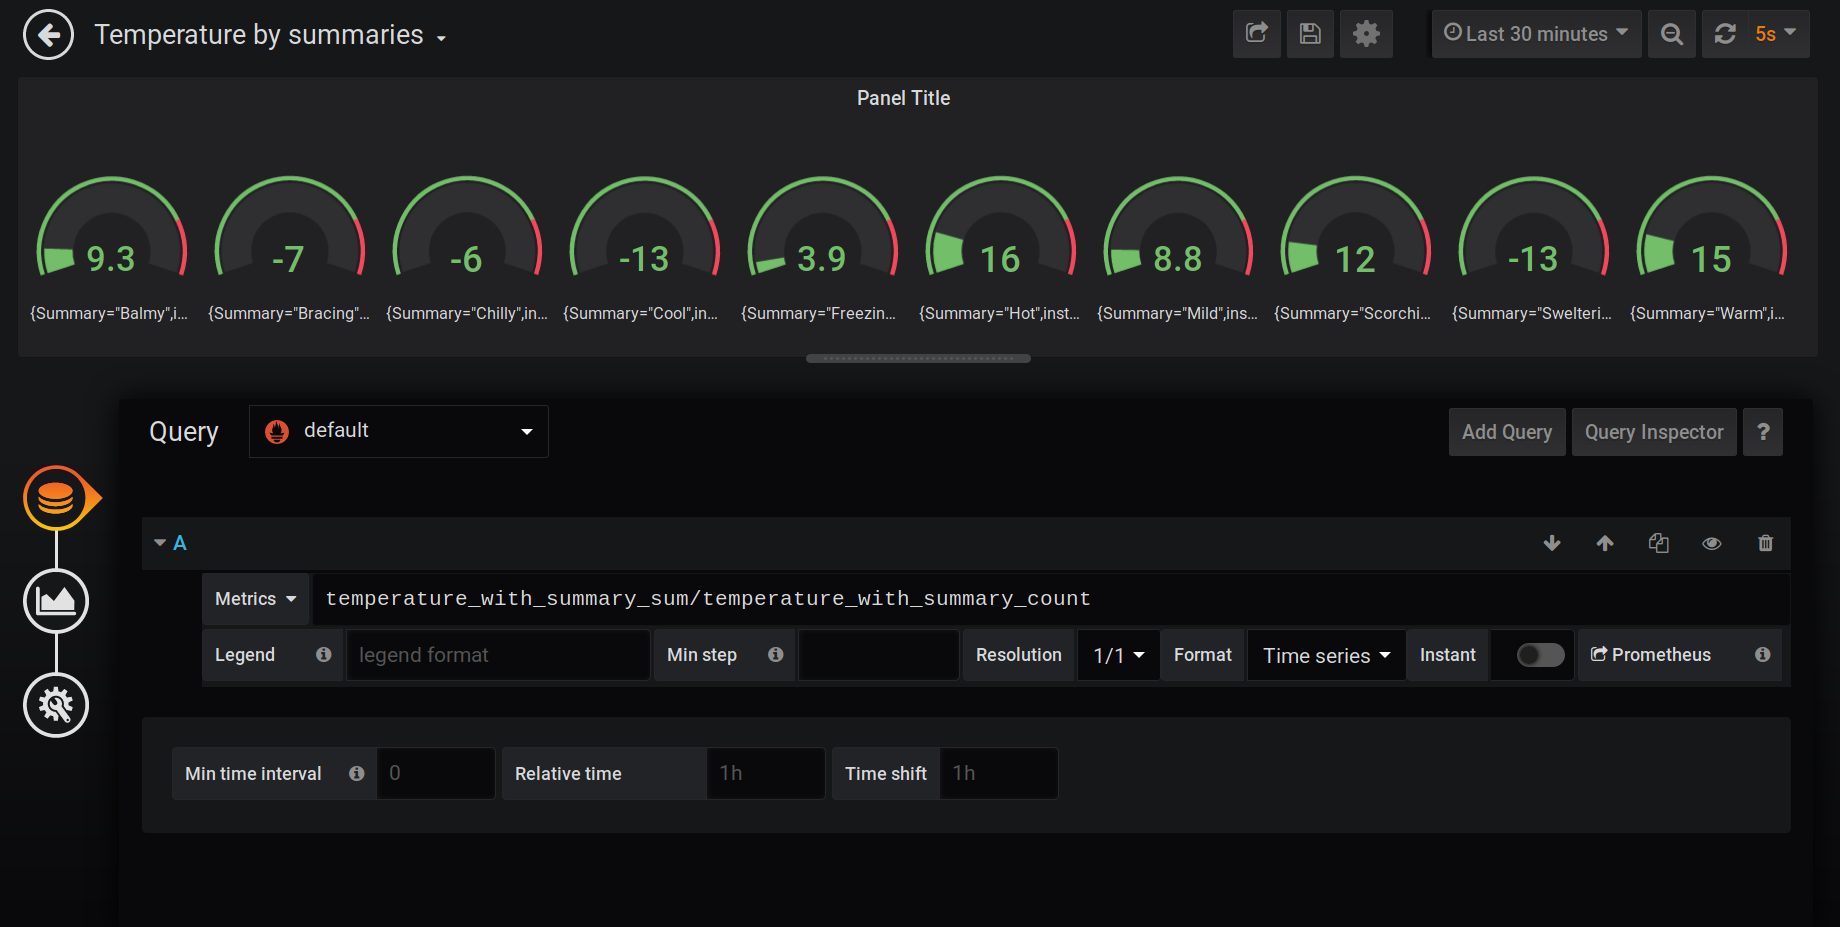
Of course, there are plenty of options to customize and compute your metrics. I’ve shown just a simple example.
Metrics from Docker
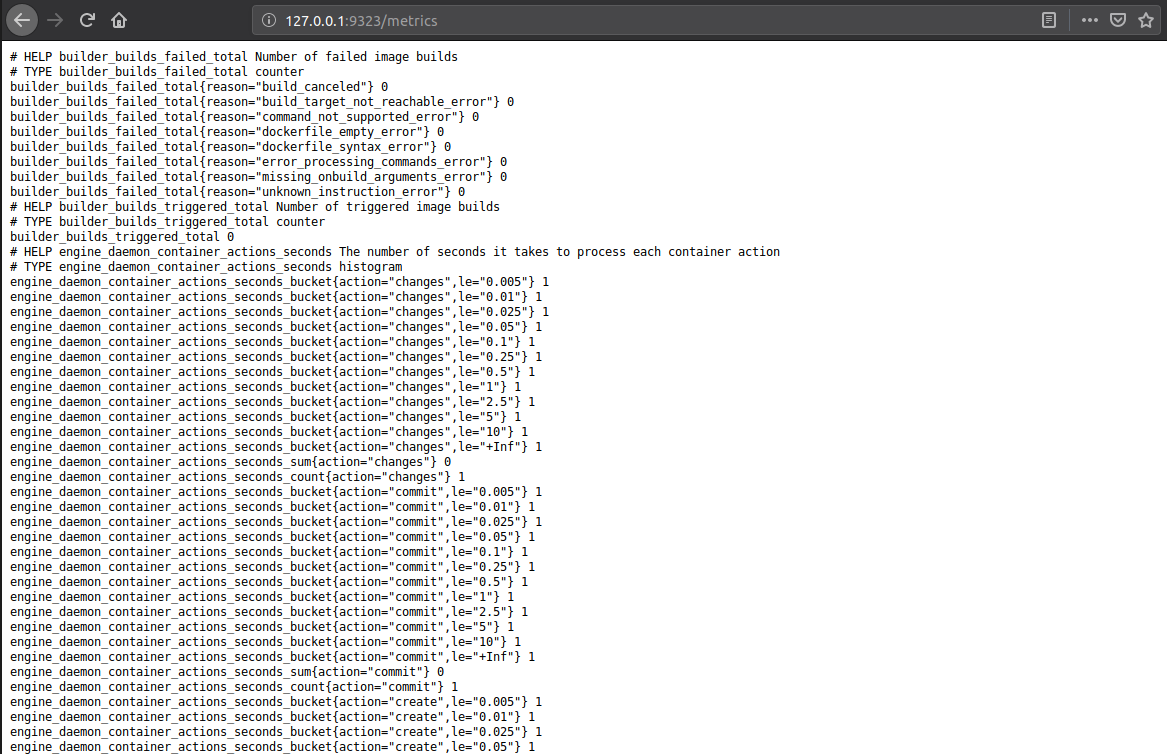
In the last section, I’ll explain how to monitor docker engine itself. Firstly, you need to modify (or create) daemon.json file. It is located in the /etc/docker/daemon.json folder by default (for Windows it is C:\ProgramData\docker\config\daemon.json). And reload docker engine.
{
  "metrics-addr" : "0.0.0.0:9323",
  "experimental" : true
}
After that, go to 127.0.0.1:9323/metrics and you’ll see different metrics from docker.
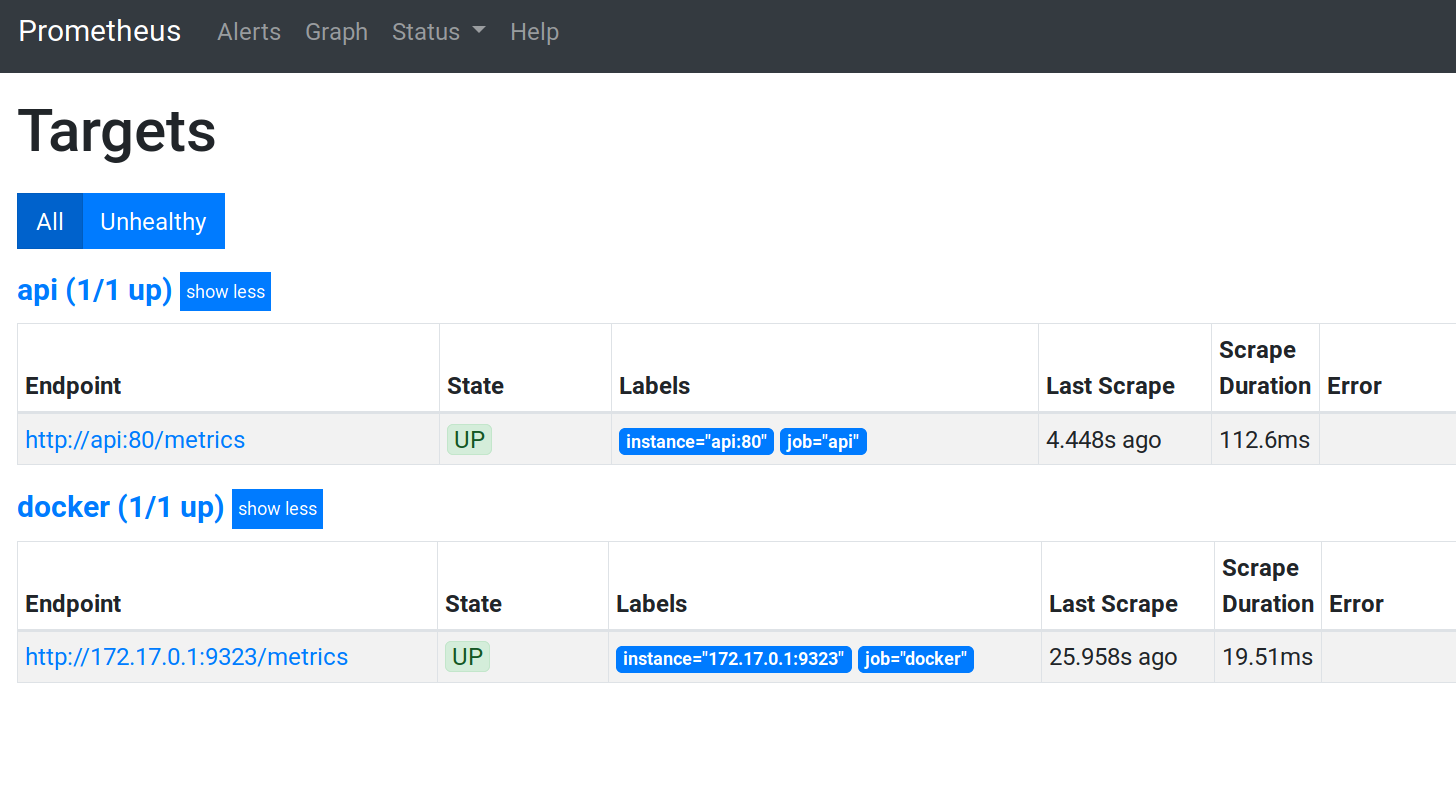
Next, specify a new job for Prometheus to grab these metrics.
scrape_configs:
  - job_name: api
    metrics_path: /metrics
    static_configs:
      - targets: ['api:80']

  - job_name: docker
    static_configs:
      - targets: ['172.17.0.1:9323']
One point here is how to find out ip address (172.17.0.1 above). In Windows you can simply use host.docker.internal. In Ubuntu run ip addr show docker0 command in the terminal.
5: docker0: <NO-CARRIER,BROADCAST,MULTICAST,UP> mtu 1500 qdisc noqueue state DOWN group default
    link/ether 00:00:00:00:00:00 brd ff:ff:ff:ff:ff:ff
    inet 172.17.0.1/16 brd 172.17.255.255 scope global docker0
       valid_lft forever preferred_lft forever
    inet6 fe80::42:b1ff:fec0:82de/64 scope link
       valid_lft forever preferred_lft forever
Finally, you’ll have a new target and metric in your Prometheus.
Conclusion
In this post we’ve discovered how to monitor web application. This is a pretty big topic, so a lot of things are left behind. We examined basic examples that help you take the first step in this area.
Image: Photo by Jean-Pierre Brungs on Unsplash
Comments