IDE can really help developers better understand their code and applications. It seems to me that if we give the IDE more data, we can find more non-obvious problems, get more ideas for optimization. So, I’ve created a small proof of concept to export OpenTelemetry data directly to Rider.
Why OpenTelemetry? Looks like it is becoming the standard for observability, and has good support in .NET. If you don’t know about OpenTelemetry, I have an introductory post.
Let’s start with a webapi application and set up OpenTelemetry. We need two packages, OpenTelemetry.Extensions.Hosting and OpenTelemetry.Instrumentation.AspNetCore. Also, I’ve made an OpenTelemetry.Exporter.Rd exporter. So, our Program.cs will look like this:
var builder = WebApplication.CreateBuilder(args);
builder.Services.AddControllers();
builder.Services.AddOpenTelemetryTracing(x =>
{
    x.SetResourceBuilder(ResourceBuilder.CreateDefault().AddService("MyWebApp"));
    x.AddAspNetCoreInstrumentation();
    x.AddRdExporter();
});

var app = builder.Build();
app.MapControllers();
app.Run();
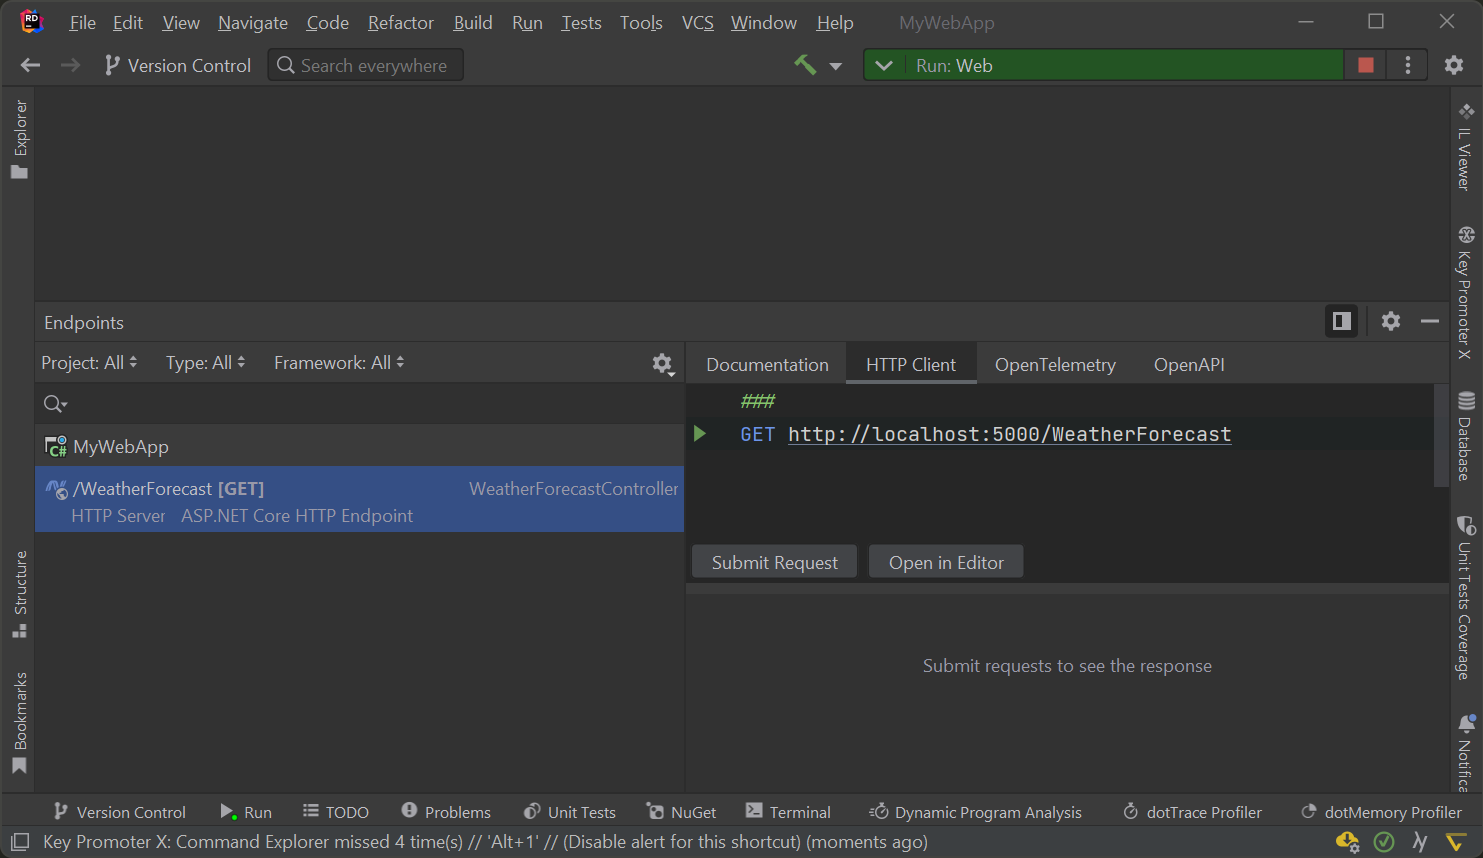
Another part is a plugin for Rider. After you install it, there will be a new OpenTelemetry tab in the Endpoints tool window.
After a few requests, a small statistic will appear for the endpoint.
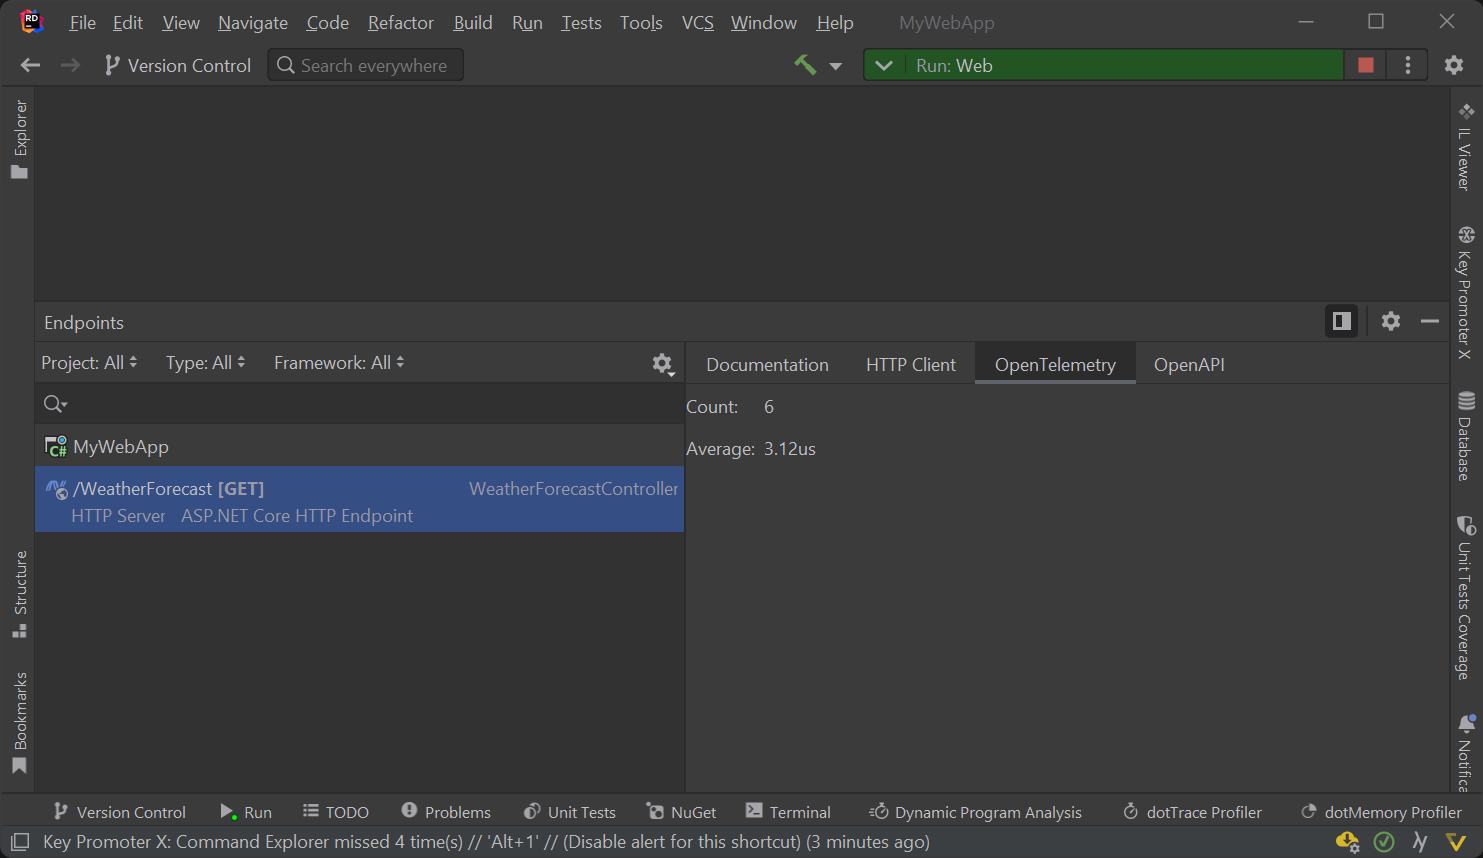
I agree that it doesn’t look outstanding right now. But in theory, with this data the IDE will be able to show in the editor the execution time of each controller, http-request, database query. Highlight what might need your attention, show all the metrics right in the code. And most importantly, it will not require you to use any additional tools. What do you think about it?
Comments