Observability is a crucial concept for nowadays systems. When you deploy your application to the cloud, you want to preserve its visibility to you. It is essential to detect any problems as early as possible and to be able to figure out the cause of them. Observability can help you with it. Moreover, it could identify issues before they affect your system or users encounter them. Another reason why it may be handy is various analyses. For example, you could investigate how users interact with your system.
There are a lot of discussions about what observability is and what is not. I don’t want to get deep into them. What is clear is that many services cannot be handled without any assistance.
Observability mainly consists of logs, metrics and distributed traces.
Observability is a measure of how well internal states of a system can be inferred from knowledge of its external outputs. (Wikipedia)
There are a lot of different commercial and open-source tools that work with logs, metrics and/or traces. Sometimes it is not easy to switch from one to another (for example, in dev and test environments). Or you may have multiple languages and want to use one monitoring tool for all services. So, we need a standard way to produce telemetry data and send it to different backends. OpenTelemetry can deal with these problems.
OpenTelemetry is a set of APIs, SDKs, tooling and integrations that are designed for the creation and management of telemetry data such as traces, metrics, and logs. (OpenTelemetry)
It is an open-source vendor-agnostic way to generate and export your telemetry data to different backends. So, you only once instrument your code and then change monitoring tools as you want.

I should note that for now, different components have different statuses.
| Status | Tracing | Metrics | Logging |
|---|---|---|---|
| API | stable, feature-freeze | stable | draft |
| SDK | stable | feature-freeze | draft |
| Protocol | stable | stable | beta |
Sample
I’m going to show some code examples further, so need to create a test project. I’ll use plain ASP.NET Core application:
dotnet new web -n open-telemetry-in-dotnet
var builder = WebApplication.CreateBuilder(args);
var app = builder.Build();

app.MapGet("/", () => "Hello World!");

app.Run();
Source code is available on GitHub.
Distributed traces
We’ll start with more familiar distributed traces. They appeared in .NET some time ago, and you may see many posts about introducing traces to your application. I have such a post too 🙂. But now, I want to compare them with metrics API, so let’s look at a basic example.
First of all, we need to install some nuget-packages.
dotnet add package OpenTelemetry.Extensions.Hosting -v 1.0.0-rc8
dotnet add package OpenTelemetry.Instrumentation.AspNetCore -v 1.0.0-rc8
And register in the DI:
builder.Services.AddOpenTelemetryTracing(x =>
{
    x.SetResourceBuilder(ResourceBuilder.CreateDefault().AddService("MyService"));
    x.AddAspNetCoreInstrumentation();
});
I’m using one service to simplify this example. Of course, the primary purpose of distributed tracing is to “connect” different parts of your system and trace the request through them. So, in real scenarios, you should instrument all your services.
Another simplification is using only APS.NET Core instrumentation. As I said, traces should go all the way across your system. So, it would be best if you instrumented all your communication libraries and databases. Some examples you can find here. If you want to produce your own traces, you simply have to create a new ActivitySource, add it to the DI and start activities wherever you want.
const string customActivitySourceName = "MySource";
var activitySource = new ActivitySource(customActivitySourceName);

builder.Services.AddOpenTelemetryTracing(x =>
{
    x.SetResourceBuilder(ResourceBuilder.CreateDefault().AddService("MyService"));
    x.AddAspNetCoreInstrumentation();
    x.AddSource(customActivitySourceName);
});
app.MapGet("/", () =>
{
    using (var activity = activitySource.StartActivity())
    {
        activity?.AddTag("custom.tag", "hello-world");
        return "Hello World!";
    }
});
And the final part is to export your traces to some system. It’s possible to use different ones. In the previous post, I showed the Jaeger exporter, but this post is about OpenTelemetry, therefore, we will apply the OpenTelemetry Exporter.
dotnet add package OpenTelemetry.Exporter.OpenTelemetryProtocol -v 1.2.0-rc1
builder.Services.AddOpenTelemetryTracing(x =>
{
    x.SetResourceBuilder(ResourceBuilder.CreateDefault().AddService("MyService"));
    x.AddAspNetCoreInstrumentation();
    x.AddSource(customActivitySourceName);
    x.AddOtlpExporter(options =>
    {
        options.Endpoint = new Uri("http://collector:4317");
    });
});
Metrics
It’s time to move on to the next part. New metrics API comes with .NET 6.
builder.Services.AddOpenTelemetryMetrics(x =>
{
    x.SetResourceBuilder(ResourceBuilder.CreateDefault().AddService("MyService"));
    x.AddAspNetCoreInstrumentation();
    x.AddOtlpExporter(options =>
    {
        options.Endpoint = new Uri("http://collector:4317");
    });
});
As you may see, it’s very similar to the traces API. Isn’t that great?
And what if you want a custom metric? It’s similar too.
const string customMeterName = "MyMeter";
var meter = new Meter(customMeterName);
var counter = meter.CreateCounter<int>("my-counter");
builder.Services.AddOpenTelemetryMetrics(x =>
{
    x.SetResourceBuilder(ResourceBuilder.CreateDefault().AddService("MyService"));
    x.AddAspNetCoreInstrumentation();
    x.AddMeter(customMeterName);
    x.AddOtlpExporter(options =>
    {
        options.Endpoint = new Uri("http://collector:4317");
    });
});
app.MapGet("/", () =>
{
    using (var activity = activitySource.StartActivity())
    {
        activity?.AddTag("custom.tag", "hello-world");
        counter.Add(1);
        return "Hello World!";
    }
});
There are four types of metrics: Counter, ObservableCounter, ObservableGauge and Histogram. Again, to simplify this post, I won’t go into the details. You can find all information with examples in the documentation.
Logs
As I’ve shown earlier, logging is in draft status, but it’s possible to send logs through the same OtlpExporter.
dotnet add package OpenTelemetry.Exporter.OpenTelemetryProtocol.Logs -v 1.0.0-rc8
In the case of logs, registration is slightly different, but not so much.
builder.Logging.AddOpenTelemetry(x =>
{
    x.SetResourceBuilder(ResourceBuilder.CreateDefault().AddService("MyService"));
    x.IncludeFormattedMessage = true;
    x.IncludeScopes = true;
    x.ParseStateValues = true;
    x.AddOtlpExporter(options =>
    {
        options.Endpoint = new Uri("http://collector:4317");
    });
});
app.MapGet("/", (ILogger<Program> logger) =>
{
    logger.LogInformation("Request");
    using (var activity = activitySource.StartActivity())
    {
        activity?.AddTag("custom.tag", "hello-world");
        counter.Add(1);
        return "Hello World!";
    }
});
Finally, our application is ready. We send all telemetry data, now it’s the collector’s turn.
Collector
As you have seen, we’re using this endpoint http://collector:4317 to export our traces, metrics and logs. Next, we need something to acquire them.
OpenTelemetry Collector receives telemetry data from your application, somehow processes it and sends it to the final destinations.

Before that, we used various agents for logs, metrics and traces in our production system. Each of them you need to configure, deploy, maintain. With OTel Collector, data collection becomes more convenient. Moreover, it has a lot of extensions, so you could connect it with almost any backend as you would like.
To configure it, I’ve created a particular file collector.yaml.
receivers:
  otlp:
    protocols:
      grpc:
      http:

exporters:
  prometheus:
    endpoint: 0.0.0.0:8889
  otlp:
    endpoint: tempo:4317
    tls:
      insecure: true
  loki:
    endpoint: http://loki:3100/loki/api/v1/push
    format: json
    labels:
      resource:
        service.name: "service_name"
        service.instance.id: "service_instance_id"

service:
  pipelines:
    metrics:
      receivers: [ otlp ]
      exporters: [ prometheus ]
    traces:
      receivers: [ otlp ]
      exporters: [ otlp ]
    logs:
      receivers: [ otlp ]
      exporters: [ loki ]
I define the main components in this file and bind them in the service section. Collector will get the data with the otlp receiver and send it with prometheus, otlp, loki exporters. More information about the Collector configuration you can find in the documentation.
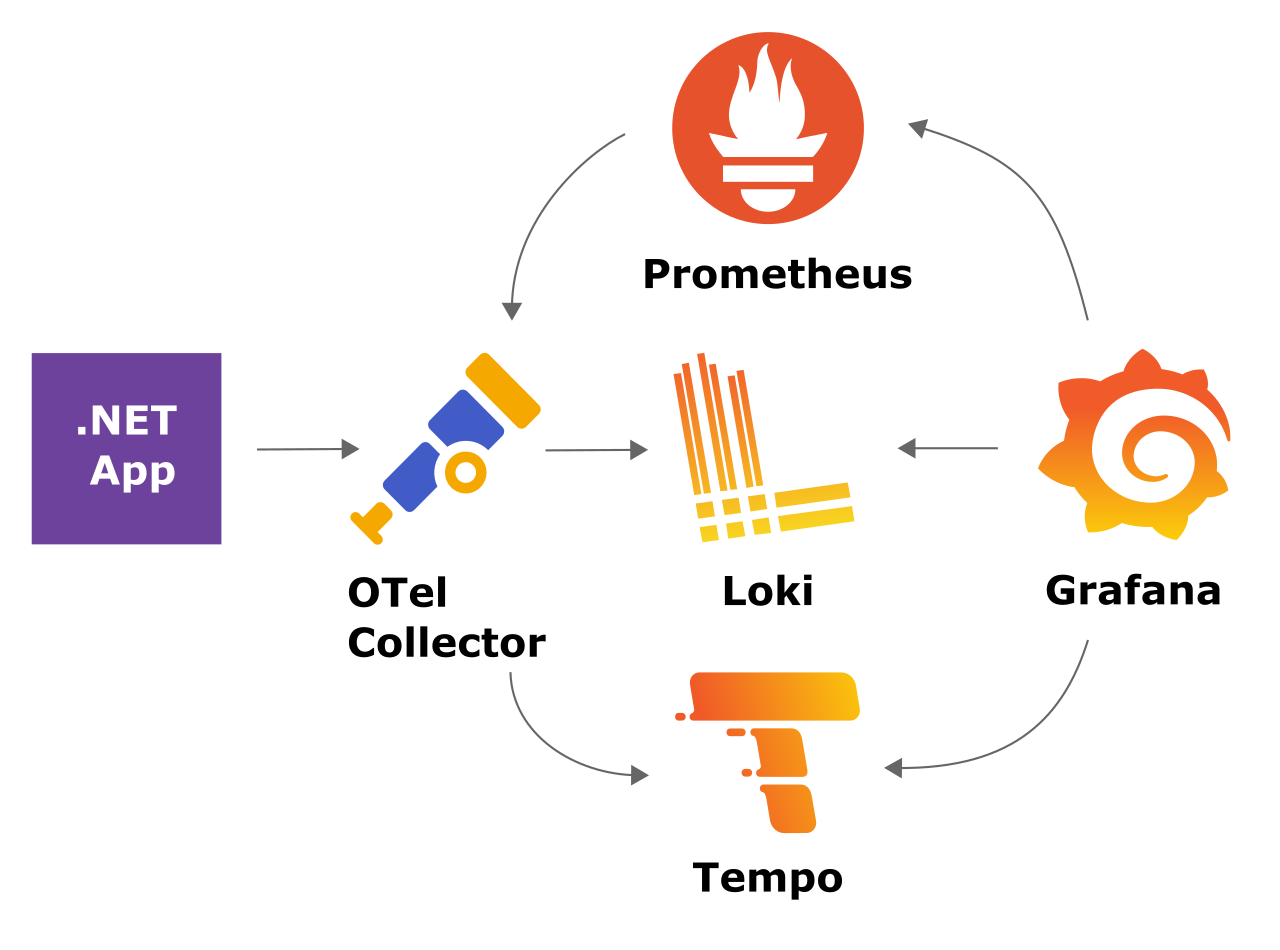
Prometheus, Tempo, Loki
We’ll use Prometheus, Tempo and Loki as our data backends and Grafana for visualization. These tools form the Grafana stack. To run it all together, let’s create a docker-compose.yml file.
version: "3.9"
services:
  app:
    container_name: app
    build:
      context: .
      dockerfile: Dockerfile
    ports:
      - "5000:80"

  collector:
    image: otel/opentelemetry-collector-contrib:0.42.0
    container_name: collector
    command: [ "--config=/etc/collector.yaml" ]
    volumes:
      - ./collector.yaml:/etc/collector.yaml

  prometheus:
    image: prom/prometheus:latest
    container_name: prometheus
    volumes:
      - ./prometheus.yml:/etc/prometheus/prometheus.yml

  tempo:
    image: grafana/tempo:latest
    command: [ "-config.file=/etc/tempo.yaml" ]
    volumes:
      - ./tempo.yaml:/etc/tempo.yaml

  loki:
    image: grafana/loki:latest
    command: [ "-config.file=/etc/loki/local-config.yaml" ]

  grafana:
    image: grafana/grafana:8.3.3
    ports:
      - "3000:3000"
    volumes:
      - ./grafana-datasources.yaml:/etc/grafana/provisioning/datasources/datasources.yaml
    environment:
      - GF_AUTH_ANONYMOUS_ENABLED=true
      - GF_AUTH_ANONYMOUS_ORG_ROLE=Admin
      - GF_AUTH_DISABLE_LOGIN_FORM=true
    depends_on:
      - prometheus
      - tempo
      - loki
The overall scheme looks like:
Run the following command and go to the Grafana UI http://localhost:3000/.
docker-compose up -d
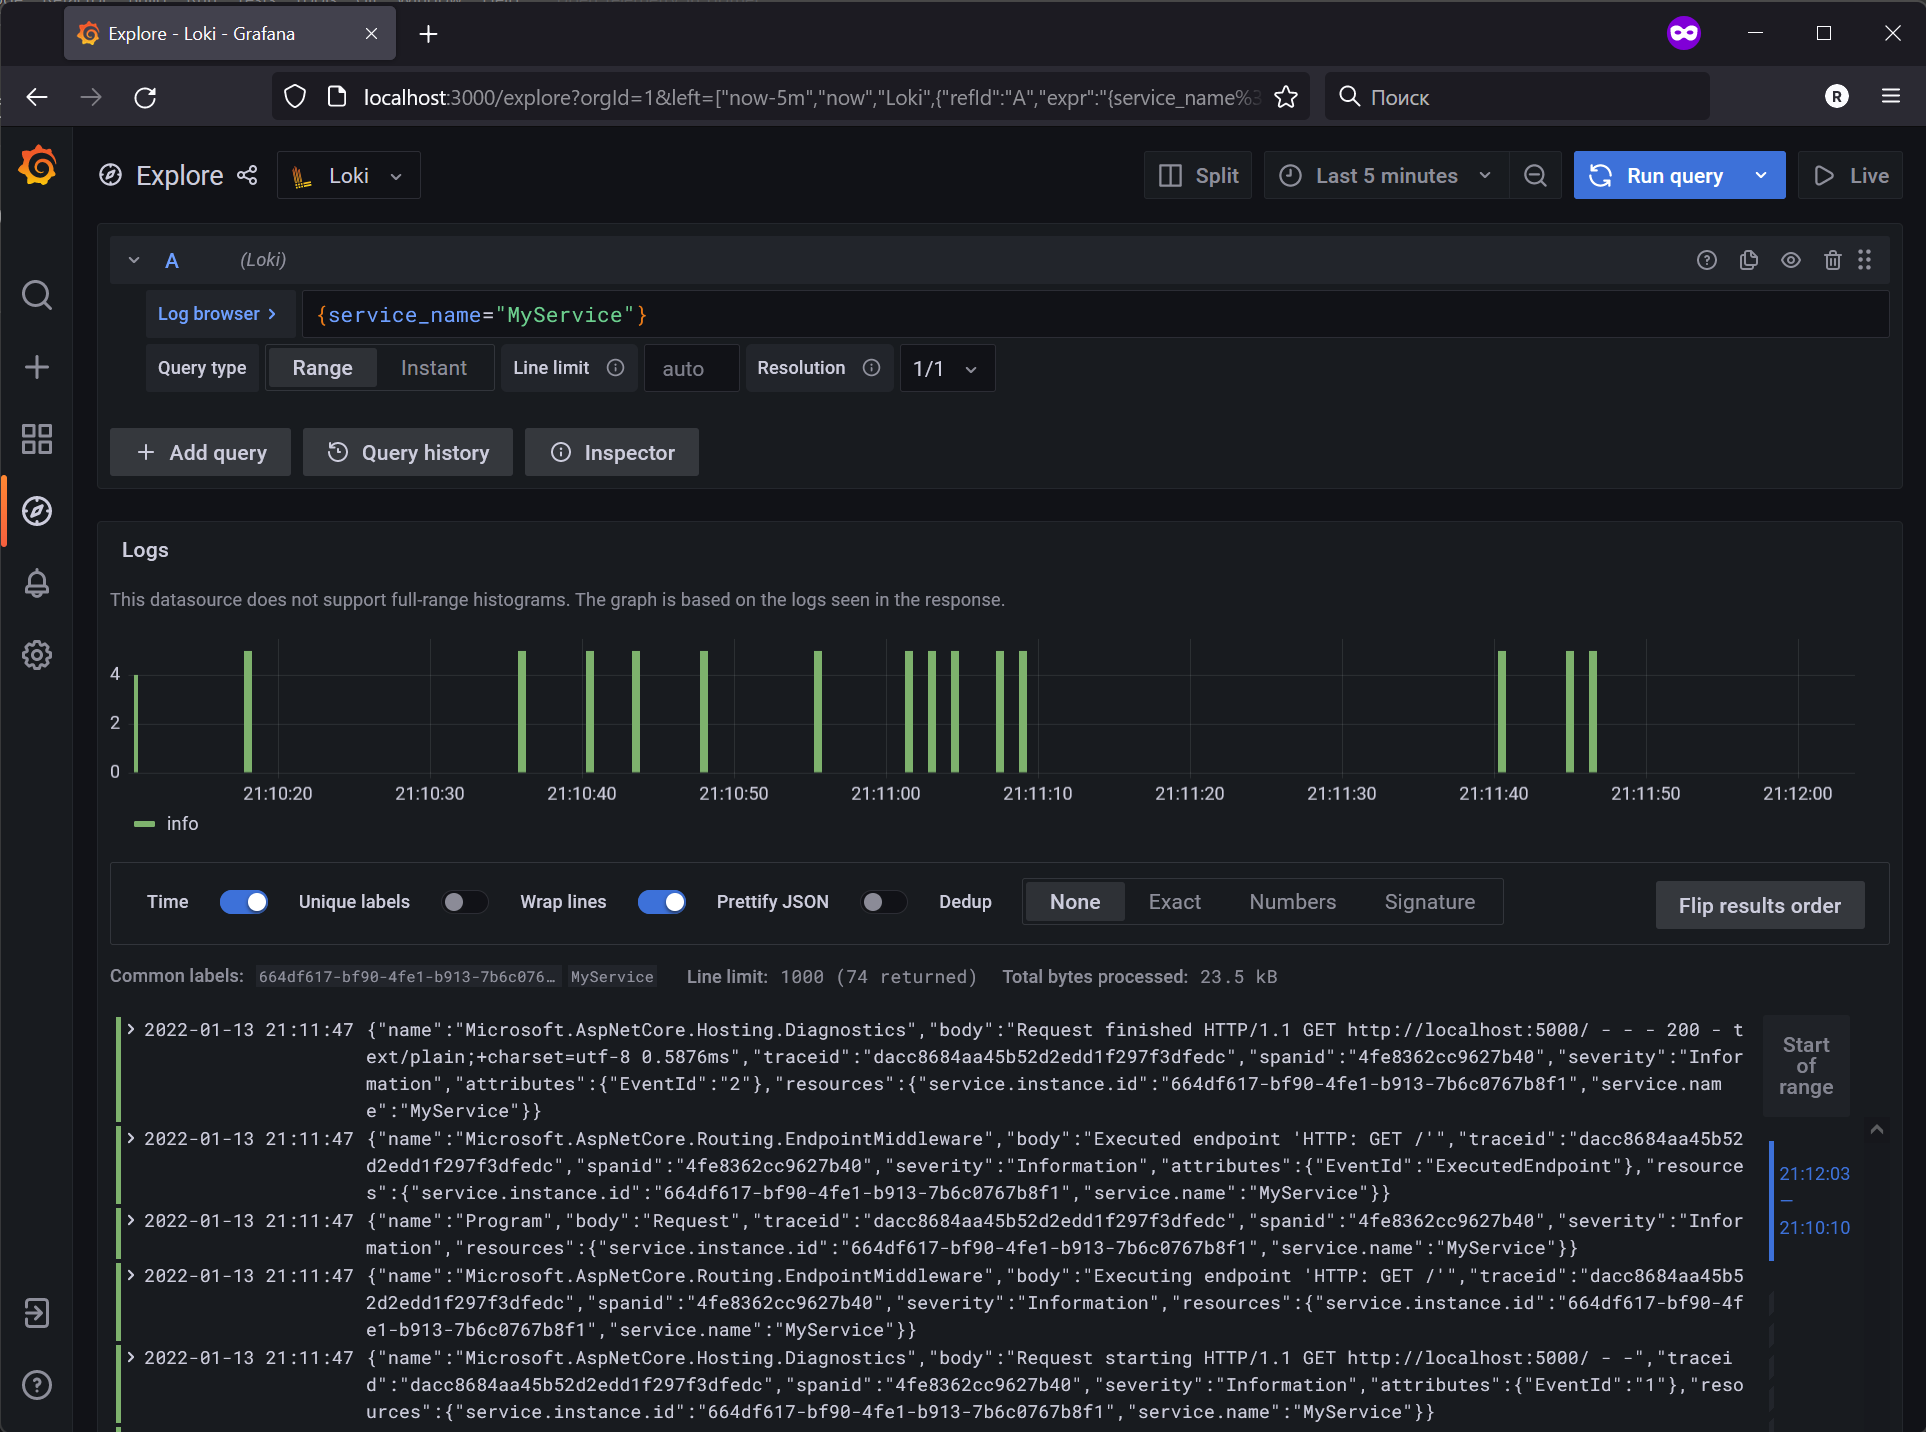
Firstly, let’s take a look at logs. Choose Loki and search for query {service_name="MyService"}. You’ll see all items for the service.
Next, open one of them, and there will be additional fields in a nice format. Next to the TraceID field, you notice a link. Let’s follow it.
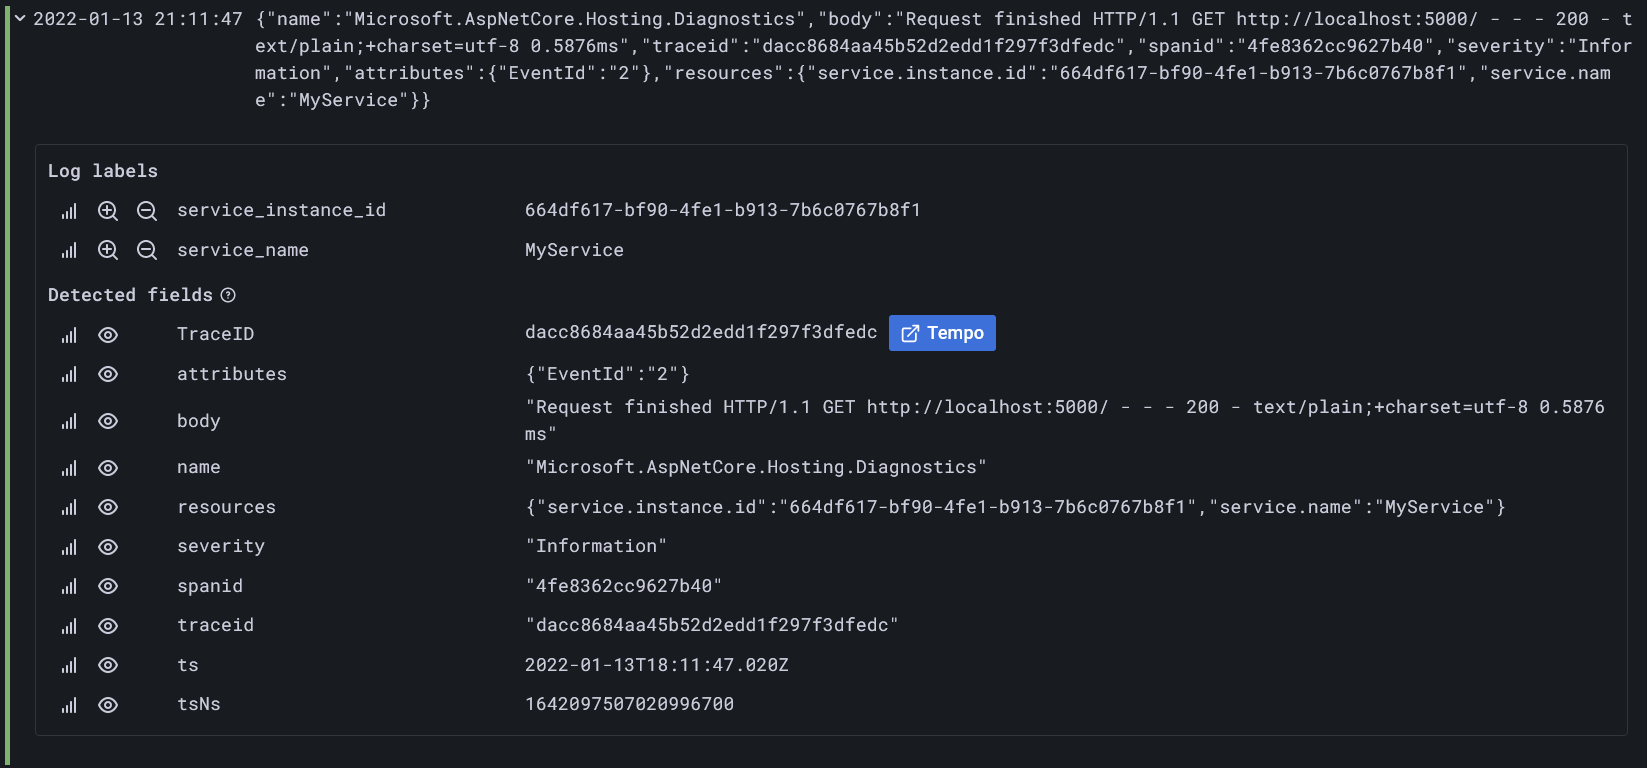
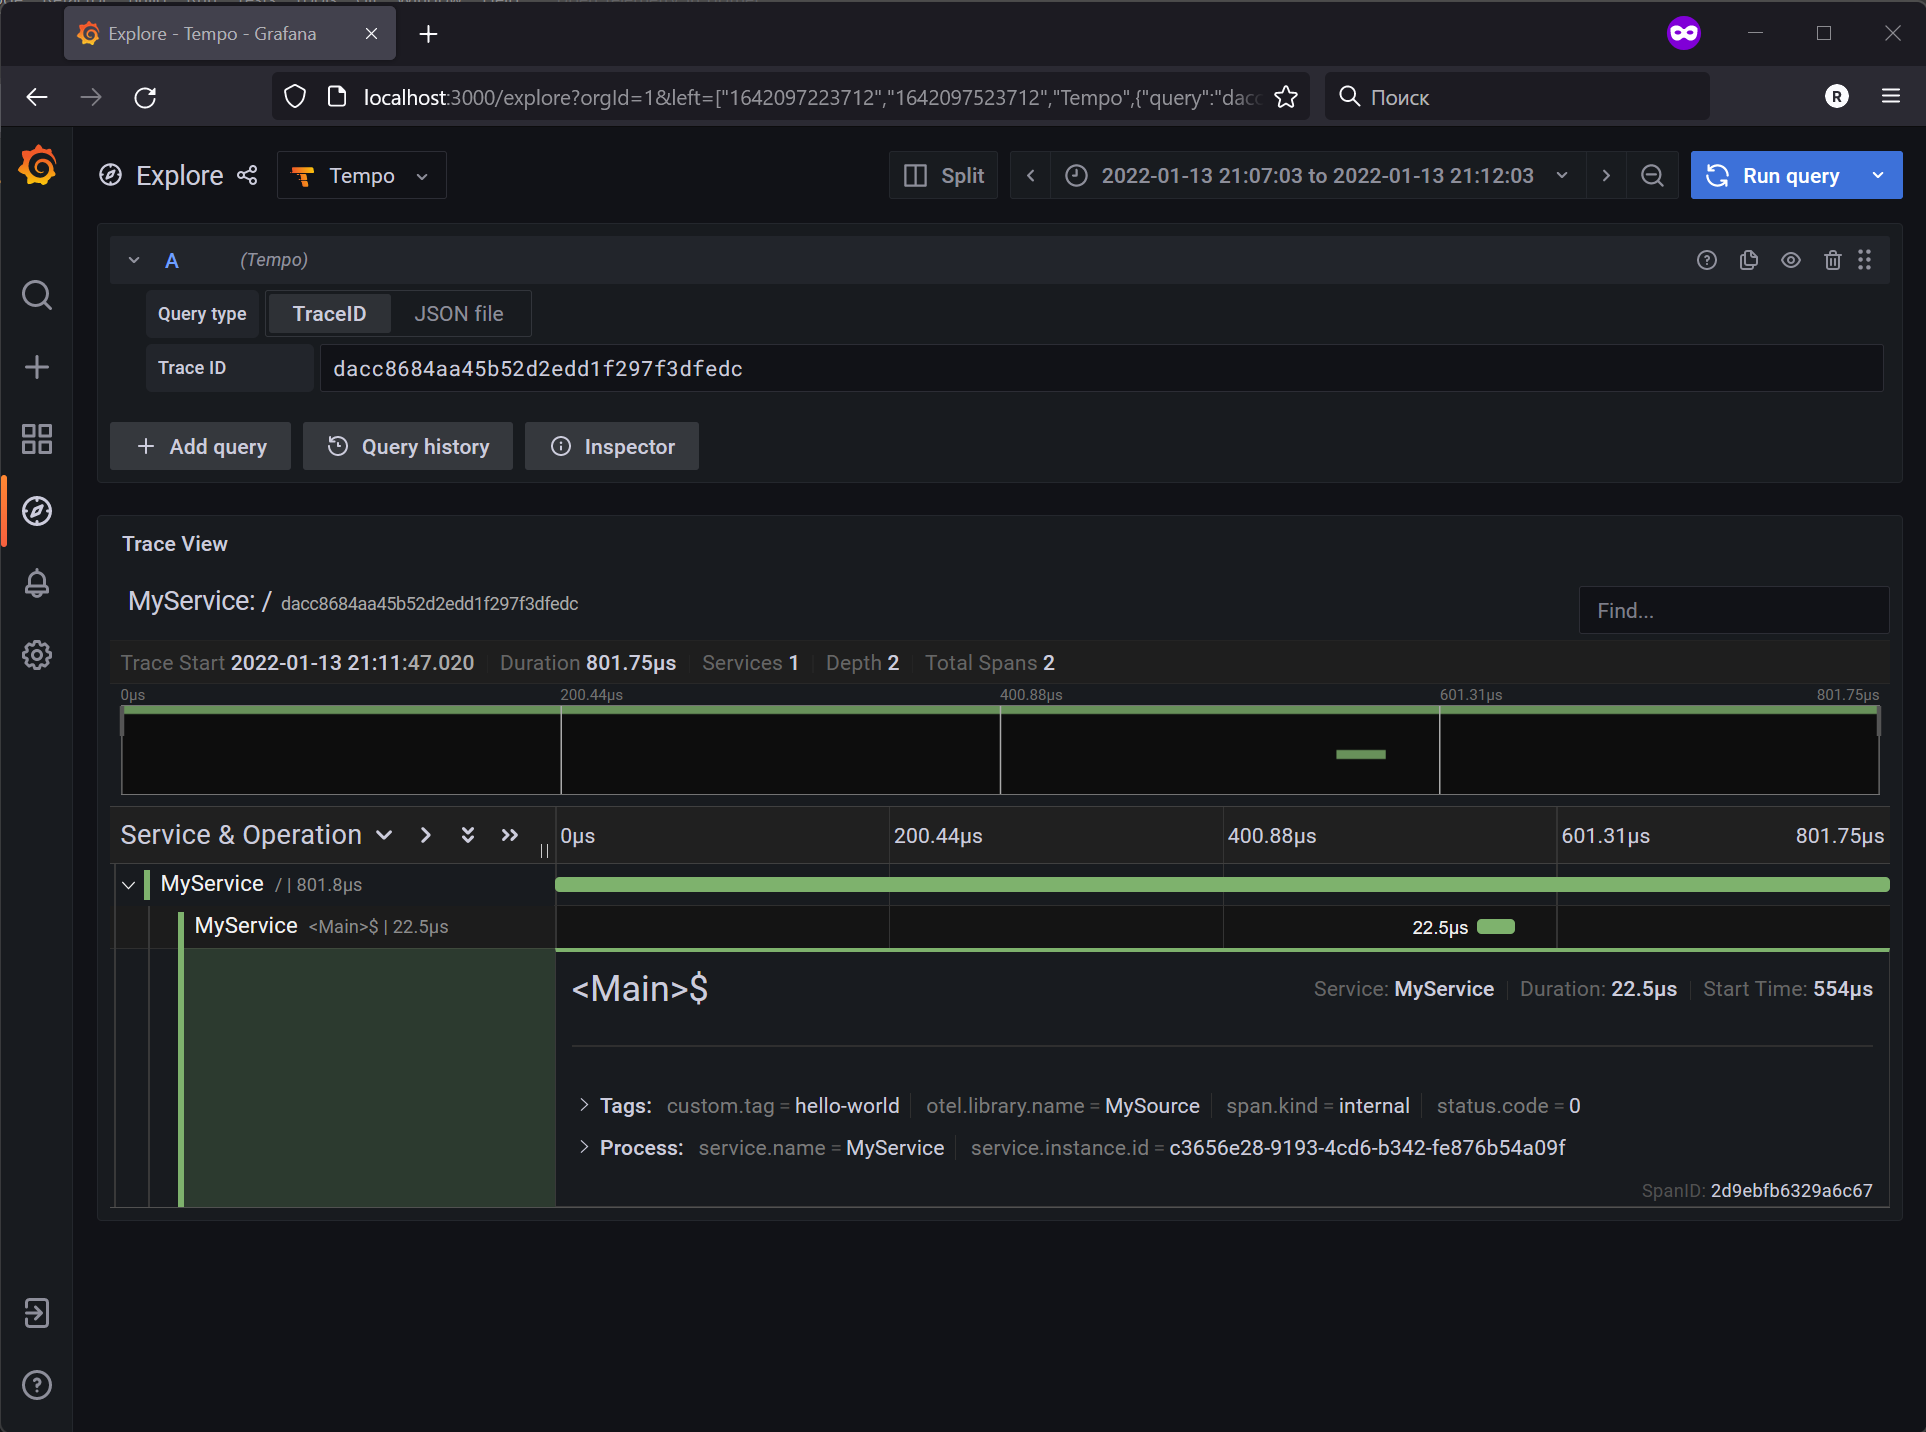
You’ll see a trace for that call. In my opinion, it’s very handy and will save you a lot of time.
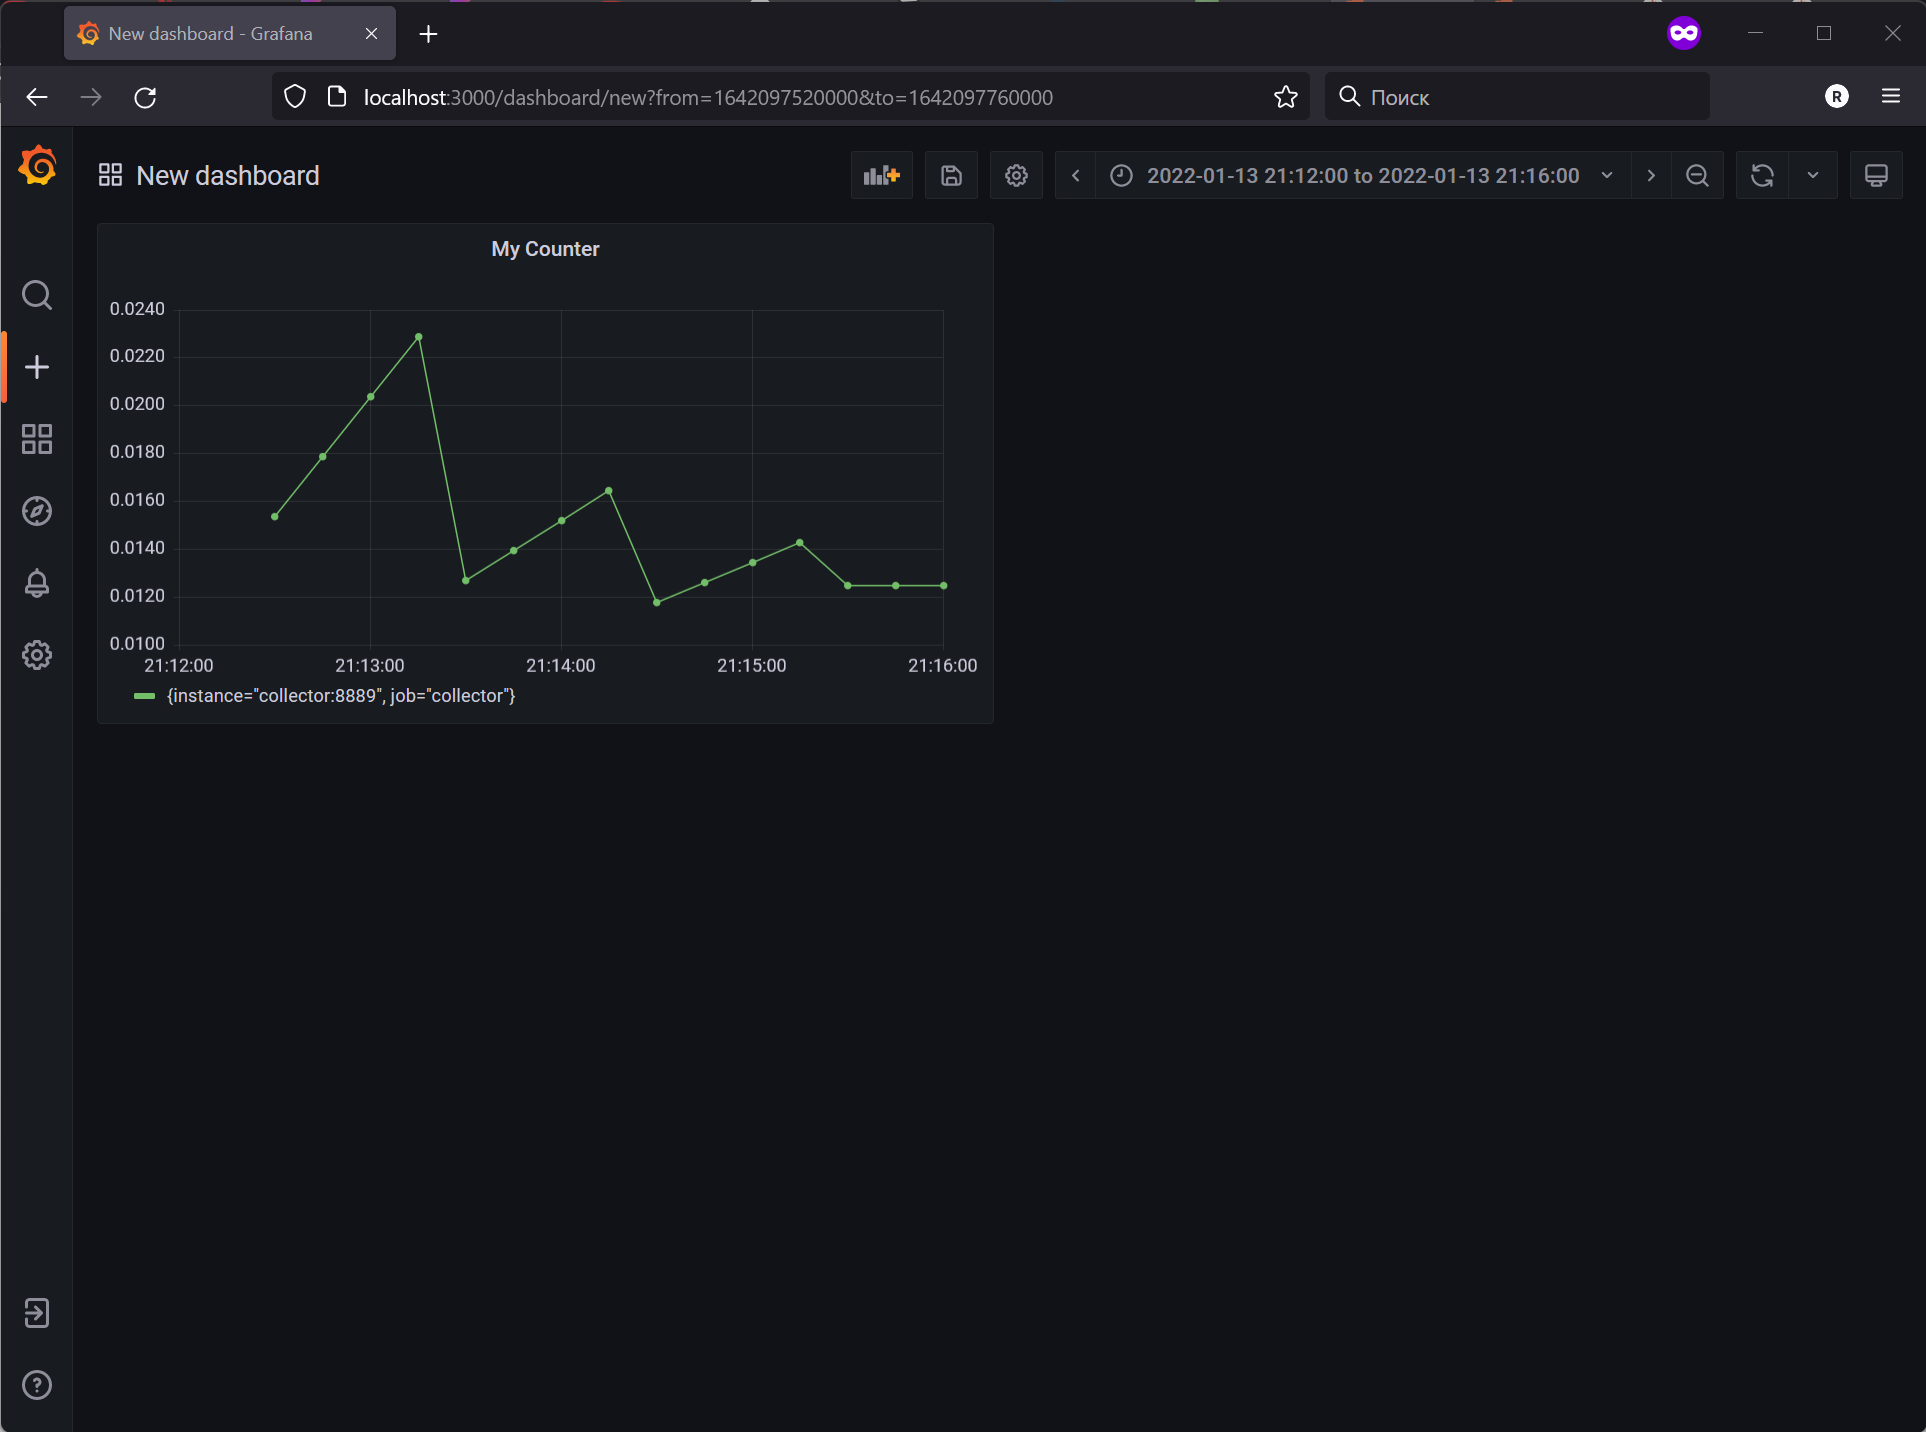
In the end, we may create dashboards for our metrics.
Of course, there are much more features in these tools; I’ve shown just basic ones. As always, you may find them in the documentation 😉.
Conclusion
Observability is one of the first things to keep in mind when building a modern cloud application. It will save you tons of time and effort during troubleshooting. Thanks to the new APIs in .NET and OpenTelemetry, it can be set up in a few minutes 💪. And Grafana makes the process even more enjoyable.
References
The source code is available here
Comments