Do you know that .NET sends you a lot of useful information, even if you didn’t do anything for it? Moreover, you can publish your own diagnostics events and somehow handle them later in a production. I’ve faced with the need to monitor various events inside my application and correlate them. In this case, diagnostics events helped me a lot.
This post mainly focus on counters and metrics, in the next one I’m going to discuss traces.
EventCounters
Let’s start with counters. I’ve already written about them in the past. This mechanism allows you to track your application metrics. These counters can be emitted by .NET, libraries or your own code.
Default counters
To look at them, create a simple console application.
$ dotnet new console -n simple-console
Modify it a little and run it.
Console.WriteLine("EventCounters sample application");
Console.ReadKey();
We can monitor EventCounters with dotnet-counters tool. Install it and start monitoring your application.
$ dotnet tool install --global dotnet-counters
$ dotnet-counters monitor -n simple-console
Even in such simple application, there are some useful counters. Notice that we didn’t do anything to publish them.
[System.Runtime]
    % Time in GC since last GC (%)                                 0
    Allocation Rate (B / 1 sec)                                 8168
    CPU Usage (%)                                                  0
    Exception Count (Count / 1 sec)                                0
    GC Committed Bytes (MB)                                        0
    GC Fragmentation (%)                                           0
    GC Heap Size (MB)                                              0
    Gen 0 GC Count (Count / 1 sec)                                 0
    Gen 0 Size (B)                                                 0
    Gen 1 GC Count (Count / 1 sec)                                 0
    Gen 1 Size (B)                                                 0
    Gen 2 GC Count (Count / 1 sec)                                 0
    Gen 2 Size (B)                                                 0
    IL Bytes Jitted (B)                                        21183
    LOH Size (B)                                                   0
    Monitor Lock Contention Count (Count / 1 sec)                  0
    Number of Active Timers                                        0
    Number of Assemblies Loaded                                    6
    Number of Methods Jitted                                     192
    POH (Pinned Object Heap) Size (B)                              0
    ThreadPool Completed Work Item Count (Count / 1 sec)           0
    ThreadPool Queue Length                                        0
    ThreadPool Thread Count                                        0
    Time spent in JIT (ms / 1 sec)                                 0
    Working Set (MB)                                              21
Also, this tool can save your counters to a file, for example in CSV format. After that, it’s possible to plot the graphs from this file and look at the dynamics of your counters. I’m using CSV Plot site for such purpose.
Here is an example plot for our simple application.
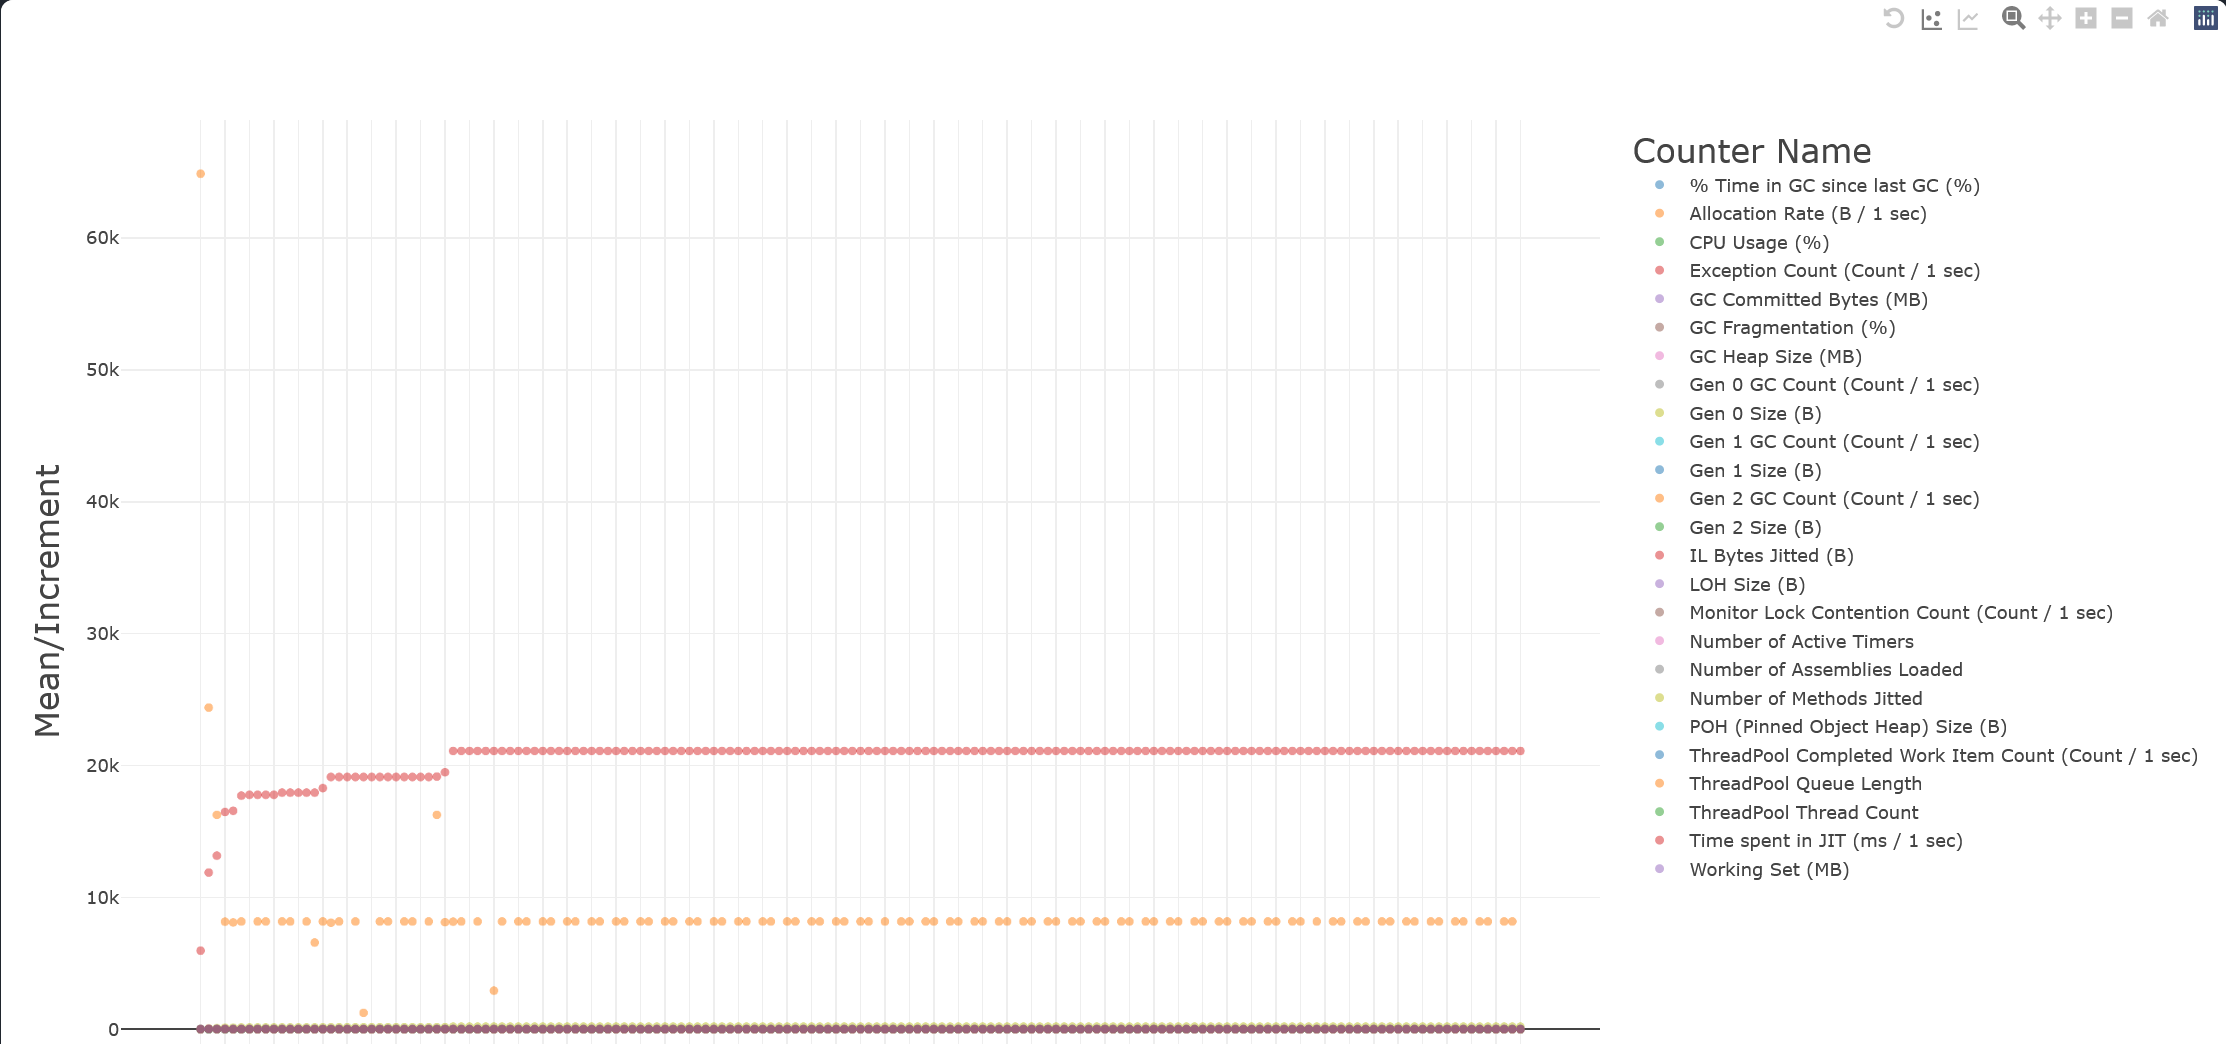
I think that dotnet-counters is a handy tool to quickly analyse what’s going on with your application. Of course, more sophisticated solutions as Prometheus or OpenTelemetry should be used in production. But if you don’t have them or in your local development, dotnet-counters could be the right choice.
Custom counters
As I said early, you may want to publish your own counter. To do that, we have to implement an EventSource, because EventCounters are built on top of the tracing mechanism. We’ll discuss it in the next post.
A simple counter may look like this:
[EventSource(Name = "Example.MyEventCounterSource")]
public sealed class MyEventCounterSource : EventSource
{
    public static readonly MyEventCounterSource Instance = new();
    private readonly IncrementingEventCounter _myCounter;

    private MyEventCounterSource() =>
        _myCounter = new IncrementingEventCounter("my-counter", this)
        {
            DisplayName = "My Incrementing Counter"
        };

    public void Up() => _myCounter.Increment();

    protected override void Dispose(bool disposing)
    {
        _myCounter.Dispose();
        base.Dispose(disposing);
    }
}
There are four different types of counters, you can find them (and some examples) in the documentation.
Next, modify our application:
Console.WriteLine("EventCounters sample application");

Task.Run(async () => await CounterProducingTask());

Console.ReadKey();

async Task CounterProducingTask()
{
    while (true)
    {
        MyEventCounterSource.Instance.Up();
        await Task.Delay(200);
    }
}
To observe this counter, use the dotnet-counters tool again.
$ dotnet-counters monitor -n simple-console --counters Example.MyEventCounterSource
[Example.MyEventCounterSource]
    My Incrementing Counter (Count / 1 sec)            5
With --counters parameter, we can specify the source we are interested in (Example.MyEventCounterSource in our case), or even particular metrics. For example, here is the result for such providers System.Runtime[cpu-usage,alloc-rate,exception-count],Example.MyEventCounterSource.
[System.Runtime]
    Allocation Rate (B / 1 sec)                    16096
    CPU Usage (%)                                      0
    Exception Count (Count / 1 sec)                    0
[Example.MyEventCounterSource]
    My Incrementing Counter (Count / 1 sec)            5
You can find other available counters in this list, or third-party libraries may provide some.
Consuming counters
You can consume counters not only with CLI tool. One of the worthy approaches is to analyse some counters inside your application and react to them in one way or another. I’ve used such a technique to implement a tricky backpressure mechanism.
EventListener
To monitor counters within your application, you need to implement EventListener class. In our basic example, we’ll write received values to the console.
public sealed class MyEventCounterListener : EventListener
{
    protected override void OnEventSourceCreated(EventSource eventSource)
    {
        if (eventSource.Name == "Example.MyEventCounterSource")
        {
            var args = new Dictionary<string, string?> { ["EventCounterIntervalSec"] = "1" };
            EnableEvents(eventSource, EventLevel.Verbose, EventKeywords.All, args);
        }
    }

    protected override void OnEventWritten(EventWrittenEventArgs eventData)
    {
        if (eventData.EventName != "EventCounters" || eventData.Payload is null)
        {
            return;
        }

        if (eventData.Payload.First() is not IDictionary<string, object> payload)
        {
            return;
        }

        Console.WriteLine($"{payload["DisplayName"]} - {payload["Increment"]}");
    }
}
And modify the main class:
Console.WriteLine("EventCounters sample application");

var listener = new MyEventCounterListener();
Task.Run(async () => await StartCounterProducingTask());

Console.ReadKey();

async Task StartCounterProducingTask()
{
    while (true)
    {
        MyEventCounterSource.Instance.Up();
        await Task.Delay(200);
    }
}
DiagnosticsClient
To consume our counters from another application, we’ll use Microsoft.Diagnostics.NETCore.Client nuget package. Let’s create another console application:
$ dotnet new console -n counters-listener
Also, we’ll parse vents with help of Microsoft.Diagnostics.Tracing.TraceEvent library. So, install both of these packages:
$ dotnet add package Microsoft.Diagnostics.NETCore.Client
$ dotnet add package Microsoft.Diagnostics.Tracing.TraceEvent
After that, our application will be able to obtain counters from another one.
Console.WriteLine("EventCounters listener sample application");
Console.WriteLine("Specify a target pid");
var input = Console.ReadLine();
if (!int.TryParse(input, out var pid))
{
    return;
}

var client = new DiagnosticsClient(pid);
var arguments = new Dictionary<string, string?> { ["EventCounterIntervalSec"] = "1" };
var providers = new List<EventPipeProvider>
{
    new("Example.MyEventCounterSource", EventLevel.Verbose, (long)EventKeywords.All, arguments)
};
using var session = client.StartEventPipeSession(providers, false);
using var source = new EventPipeEventSource(session.EventStream);

Console.CancelKeyPress += (_, eventArgs) =>
{
    eventArgs.Cancel = true;
    session.Stop();
};

source.Dynamic.All += HandleEvent;
source.Process();

static void HandleEvent(TraceEvent evt)
{
    if (evt.EventName != "EventCounters")
    {
        return;
    }

    if (evt.PayloadValue(0) is not IDictionary<string, object> payload)
    {
        return;
    }

    if (payload["Payload"] is not IDictionary<string, object> payloadFields)
    {
        return;
    }

    Console.WriteLine($"{payloadFields["DisplayName"]} - {payloadFields["Increment"]}");
}
As you see, this code is similar to the in-proc example. First, the user should specify a process id. Next, we define the same Example.MyEventCounterSource provider and arguments. Finally, we start an event pipe session and add a handler to the source.Dynamic.All event. The result will be the same as we saw in the previous example with EventListener.
Of course, it isn’t a production-ready code, but my goal is to demonstrate that it isn’t so difficult to produce or consume EventCounters by your own.
In my next post, I will talk about the EventPipe in more detail.
Metrics
With .NET 6 there is a new System.Diagnostics.Metrics API to support metrics. This API is connected to the OpenTelemetry project (I have another post about OpenTelemetry in .NET). And for new applications, this is the preferred way to handle metrics.
Let’s again start with a simple console application.
Custom metrics
To produce a custom metric, you should create a new Meter instance and choose an appropriate type for your metric. We’ll use a simple counter.
Console.WriteLine("Metrics sample application");

var meter = new Meter("Example.MyMeter");
var counter = meter.CreateCounter<int>("my-counter");

Task.Run(async () => await StartMetricProducingTask());

Console.ReadKey();

async Task StartMetricProducingTask()
{
    while (true)
    {
        counter.Add(1);
        await Task.Delay(200);
    }
}
To observe your application metrics, there are some exporters, but I want to show you, how to use the same dotnet-counters tool. Of course, this approach is suitable only for special cases. In production, you are likely to collect your metrics in a dedicated service (Prometheus or something else).
$ dotnet-counters monitor -n simple-console --counters Example.MyMeter
[Example.MyMeter]
    my-counter (Count / 1 sec)                         5
Also, there are some libraries with standard metrics. Add two nuget packages to our project.
$ dotnet add package OpenTelemetry
$ dotnet add package OpenTelemetry.Instrumentation.Runtime
And register runtime metrics.
Console.WriteLine("Metrics sample application");

var meter = new Meter("Example.MyMeter");
var counter = meter.CreateCounter<int>("my-counter");

using var meterProvider = Sdk.CreateMeterProviderBuilder()
    .AddRuntimeMetrics()
    .AddMeter("Example.MyMeter")
    .Build();

Task.Run(async () => await StartMetricProducingTask());

Console.ReadKey();

async Task StartMetricProducingTask()
{
    while (true)
    {
        counter.Add(1);
        await Task.Delay(200);
    }
}
After that, we can consume some pre-built runtime metrics.
$ dotnet-counters monitor -n simple-console --counters OpenTelemetry.Instrumentation.Runtime
[OpenTelemetry.Instrumentation.Runtime]
    process.cpu.count                                                       16
    process.cpu.time (s / 1 sec)
        state=system                                                         0
        state=user                                                           0
    process.memory.usage (By)                                         32763904
    process.memory.virtual (By)                                         2,2041e+12
    process.runtime.dotnet.active.timer.count (Count / 1 sec)                0
    process.runtime.dotnet.alloc.rate (By / 1 sec)                       16336
    process.runtime.dotnet.assembly.count (Count / 1 sec)                    0
    process.runtime.dotnet.gc.committed (Mi / 1 sec)                         0
    process.runtime.dotnet.gc.fragmentation (Count / 1 sec)                  0
    process.runtime.dotnet.gc.heap (By)                                2864000
    process.runtime.dotnet.gen_0-gc.count                                    0
    process.runtime.dotnet.gen_1-gc.count                                    0
    process.runtime.dotnet.gen_2-gc.count                                    0
    process.runtime.dotnet.il.bytes.jitted (By / 1 sec)                      0
    process.runtime.dotnet.methods.jitted.count (Count / 1 sec)              0
    process.runtime.dotnet.monitor.lock.contention.count                     1
    process.runtime.dotnet.threadpool.completed.items.count                349
    process.runtime.dotnet.threadpool.queue.length (Count / 1 sec)           0
    process.runtime.dotnet.threadpool.thread.count (Count / 1 sec)           0
Consuming metrics
MeterListener
Now, let’s observe metrics by our own, just as we did with counters. To do it inside your application, there is a special class MeterListener.
using var myMeterListener = new MeterListener();
myMeterListener.InstrumentPublished = (instrument, listener) =>
{
    if (instrument.Meter.Name == "Example.MyMeter")
    {
        listener.EnableMeasurementEvents(instrument);
    }
};
myMeterListener.SetMeasurementEventCallback<int>(OnMeasurementWritten);
myMeterListener.Start();

void OnMeasurementWritten(Instrument instrument, int measurement, ReadOnlySpan<KeyValuePair<string, object?>> tags,
    object? state)
{
    Console.WriteLine($"{instrument.Name} - {measurement}");
}
I’ve set a special handler for events from Example.MyMeter meter to write them to the console. As you see, very straightforward code.
Now, we’ll try to observe metrics from another process.
DiagnosticsClient
It will be a solution very similar to the counter solution. We need to modify provider list and event handling. To consume metrics, we have to subscribe to the System.Diagnostics.Metrics provider.
var arguments = new Dictionary<string, string?>
{
    ["RefreshInterval"] = "1",
    ["Metrics"] = "Example.MyMeter\\my-counter"
};
var providers = new List<EventPipeProvider>
{
    new("System.Diagnostics.Metrics", EventLevel.Verbose, (long)EventKeywords.All, arguments)
};
And parse each event to log interested information.
static void HandleEvent(TraceEvent evt)
{
    if (evt.ProviderName != "System.Diagnostics.Metrics" || evt.EventName != "CounterRateValuePublished")
    {
        return;
    }

    var meter = (string)evt.PayloadValue(1);
    var counter = (string)evt.PayloadValue(3);
    var value = (string)evt.PayloadValue(6);

    Console.WriteLine($"{meter}/{counter} - {value}");
}
Conclusion
In this post, I’ve shown how to use two different metrics API. I would like to note that metrics are very important. They are usually the first step to diagnose any problem inside your application. They can also tell you various non-obvious things about your system.
.NET gives us approaches to easily consume such information. As I said, this can be useful in various (even business) scenarios. So I think it’s good to be aware of these opportunities and have them in your toolbox.
References
The source code is available here
Comments