Counters and Metrics
Diagnostics Client plugin allows you to monitor your application's counters and metrics. This can be very handy as a first step in investigating a problem. With counters and metrics, you can get a bird's eye view of how your application is performing overall. They can give you a good clue as to what the next steps should be.

Counters
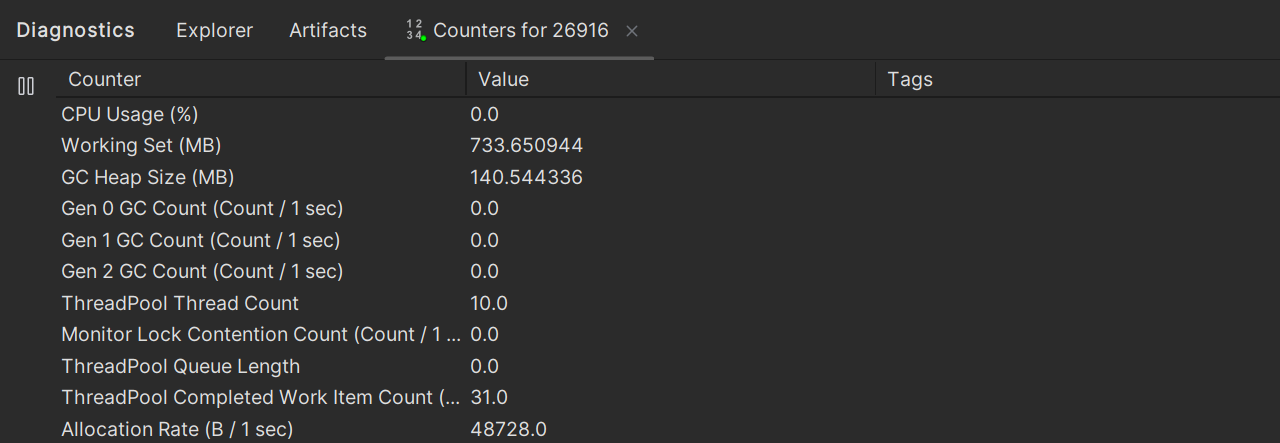
One way to monitor the performance of your application is to use EventCounters. The runtime itself and some libraries provide pre-built counters, but it is also possible to create your own counter. The plugin acts as a dotnet-counters tool, allowing you to watch counter values or export them to a file.
Watch counter values
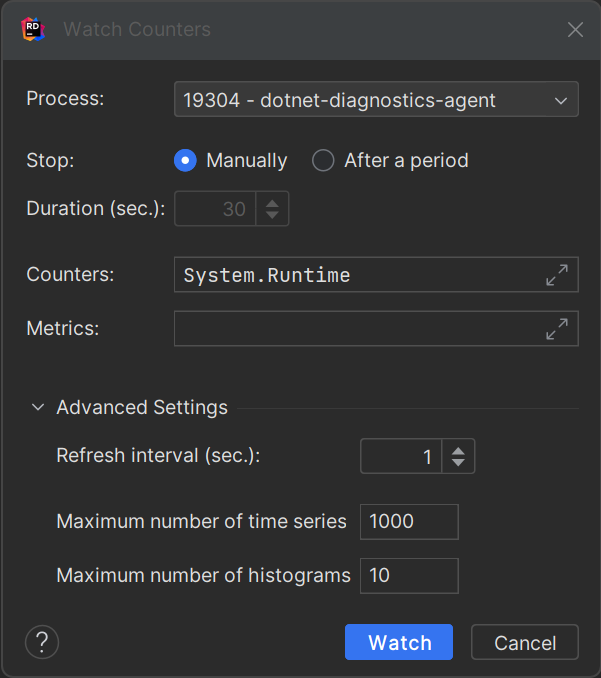
To monitor EventCounters, select the process and call the Watch Counetrs action.

- Process
You can change the target process.
- Stop
You can choose to stop monitoring by manually calling the
Stopaction or automatically after a certain period of time.- Counters
A comma-separated list of counter providers. Each provider contains its name and, optionally, a list of metrics
provider-name[metric1,metric2]. If the list of metrics is not specified, all metrics from that provider will be shown.- Metrics
A comma-separated list of meters. Optionally, you can specify a list of metrics for a specific meter in the format
meter-name[metric1,metric2].- Refresh interval
Delay between counter value updates.
- Maximum number of time series
The maximum number of time series that can be tracked. Each unique combination of provider name, metric name, and dimension values counts as one time series. Tracking more time series uses more memory in the target process so this bound guards against unintentional high memory use.
- Maximum number of histograms
The maximum number of histograms that can be tracked. Each unique combination of provider name, histogram name, and dimension values counts as one histogram. Tracking more histograms uses more memory in the target process so this bound guards against unintentional high memory use.
Counters is the field where you specify which counters you want to watch. The default is System.Runtime and it includes some basic counters such as cpu-usage, gc-heap-size, etc. A full list of its counters can be found in the page, as well as some other providers ( e.g. Microsoft.AspNetCore.Hosting, Microsoft-AspNetCore-Server-Kestrel, System.Net.Http, etc.). The default value is sufficient if you want to view the most essential metrics.
This field allows you to select not only the provider of interest, but also to filter out some counters from the provider. There are some examples:
System.RuntimeSystem.Runtime[cpu-usage,working-set]System.Net.Http[http11-connections-current-total,http20-connections-current-total]System.Runtime[cpu-usage,working-set],Microsoft.AspNetCore.HostingSystem.Runtime[cpu-usage,working-set],Microsoft.AspNetCore.Hosting[total-requests]
Custom counters
It is possible to create your own counters and watch them. To do that, you have to implement an EventSource and then use its name as a provider. You can find a full example of how to do this in the page.
Export counter values
Sometimes it is convenient to export the counter values to a file and analyse them later. For this purpose, call the Export Counters action. In the dialog, you can select the file format, file name and output folder.

Metrics
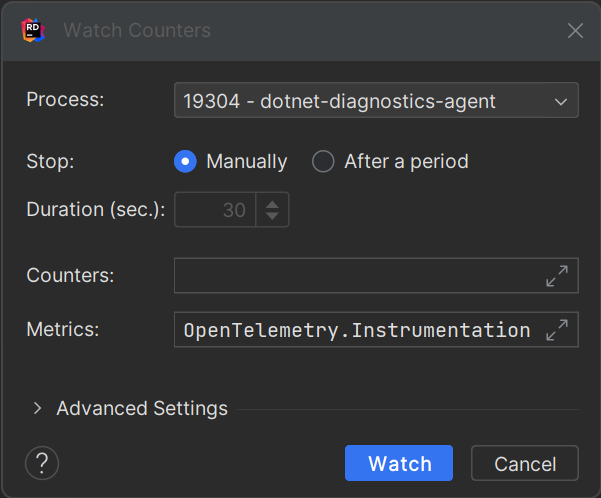
A more modern approach to reporting application metrics is to use the System.Diagnostics.Metrics API. To watch them, you can use the Metrics field in the action dialog.

The Metrics field follows the same format as the Providers field: a comma-separated list of meters. Each meter contains its name and, optionally, a list of metrics meter-name[metric1,metric2]. If no metric list is specified, all metrics for that counter will be shown. Here are some examples:
OpenTelemetry.Instrumentation.RuntimeOpenTelemetry.Instrumentation.Runtime[process.cpu.count]OpenTelemetry.Instrumentation.Runtime[process.cpu.count,process.runtime.dotnet.gen_0-gc.count]OpenTelemetry.Instrumentation.Runtime[process.cpu.count],OpenTelemetry.Instrumentation.AspNetCoreOpenTelemetry.Instrumentation.Runtime[process.cpu.count],OpenTelemetry.Instrumentation.AspNetCore[http.server.duration]