ASP.NET Core: Logs (Part 2)

In the first part, we were looking at a simple console logging with Serilog. Today we’ll go deeper and will deal with a more complicated example.
Logging to Elasticsearch
When you’re creating a real application, you want to use some storage for your logs to keep them for a long time and analyze them in the future. Of course, in this case console logging isn’t enough for you. Nowadays the most common solution is the ELK. This abbreviation means Elasticsearch, Logstash, Kibana.
- Elasticsearch is storage that allows you to save json documents and create a full-text search.
- Logstash helps us to parse data and send it to the Elasticsearch in the suitable format. We don’t need this tool because we’re using Serilog.
- Kibana is a web interface for the Elasticsearch. With Kibana you can create different charts and look at the data in a more convenient way.
Deploying ELK
There is a simple docker-compose file, made by me just for testing ELK purposes. In production you may need a more sophisticated script, but this post isn’t about tuning ELK system, so we won’t go deeper in it.
version: '3'

services:

  elasticsearch:
    image: docker.elastic.co/elasticsearch/elasticsearch:6.6.1
    environment:
      - discovery.type=single-node
    ports:
      - 9200:9200

  kibana:
    depends_on:
      - elasticsearch
    image: docker.elastic.co/kibana/kibana:6.6.1
    environment:
      ELASTICSEARCH_URL: http://elasticsearch:9200
    ports:
      - 5601:5601
Logging from docker container
If you run your application as it is, use this sink to the Elasticsearch, but I’m using docker containers. According to the document about 12-factor applications, logs should be output to the console.
A twelve-factor app never concerns itself with routing or storage of its output stream. It should not attempt to write to or manage logfiles. Instead, each running process writes its event stream, unbuffered, to stdout.
Ok, we’ve already done this in a previous part, but now we need a special formatter, which is compatible with Elasticsearch (Serilog.Formatting.Elasticsearch). Install this nuget and change the config file.
"Serilog":{
  "MinimumLevel": {
    "Default": "Information"
  },
  "WriteTo":[{
    "Name": "Console",
    "Args": {
      "formatter": "Serilog.Formatting.Elasticsearch.ElasticsearchJsonFormatter, Serilog.Formatting.Elasticsearch"
    }
  }
  ]
}
Your logs will look like this.
{"@timestamp":"2019-07-21T16:12:58.9439932+03:00","level":"Information","messageTemplate":"{HostingRequestStartingLog:l}","message":"Request starting HTTP/1.1 GET http://localhost:5000/api/values/1  ","fields":{"Protocol":"HTTP/1.1","Method":"GET","ContentType":null,"ContentLength":null,"Scheme":"http","Host":"localhost:5000","PathBase":"","Path":"/api/values/1","QueryString":"","HostingRequestStartingLog":"Request starting HTTP/1.1 GET http://localhost:5000/api/values/1  ","EventId":{"Id":1},"SourceContext":"Microsoft.AspNetCore.Hosting.Internal.WebHost","RequestId":"0HLODRKJF5Q7Q:00000001","RequestPath":"/api/values/1","CorrelationId":null,"ConnectionId":"0HLODRKJF5Q7Q"},"renderings":{"HostingRequestStartingLog":[{"Format":"l","Rendering":"Request starting HTTP/1.1 GET http://localhost:5000/api/values/1  "}]}}
{"@timestamp":"2019-07-21T16:12:58.9717607+03:00","level":"Information","messageTemplate":"Executing endpoint '{EndpointName}'","message":"Executing endpoint '\"AspNetCoreAppLogging.Controllers.ValuesController.Get (AspNetCoreAppLogging)\"'","fields":{"EndpointName":"AspNetCoreAppLogging.Controllers.ValuesController.Get (AspNetCoreAppLogging)","EventId":{"Name":"ExecutingEndpoint"},"SourceContext":"Microsoft.AspNetCore.Routing.EndpointMiddleware","RequestId":"0HLODRKJF5Q7Q:00000001","RequestPath":"/api/values/1","CorrelationId":null,"ConnectionId":"0HLODRKJF5Q7Q"}}
{"@timestamp":"2019-07-21T16:12:59.0085609+03:00","level":"Information","messageTemplate":"Route matched with {RouteData}. Executing controller action with signature {MethodInfo} on controller {Controller} ({AssemblyName}).","message":"Route matched with \"{action = \\\"Get\\\", controller = \\\"Values\\\"}\". Executing controller action with signature \"Microsoft.AspNetCore.Mvc.ActionResult`1[System.String] Get(Int32)\" on controller \"AspNetCoreAppLogging.Controllers.ValuesController\" (\"AspNetCoreAppLogging\").","fields":{"RouteData":"{action = \"Get\", controller = \"Values\"}","MethodInfo":"Microsoft.AspNetCore.Mvc.ActionResult`1[System.String] Get(Int32)","Controller":"AspNetCoreAppLogging.Controllers.ValuesController","AssemblyName":"AspNetCoreAppLogging","EventId":{"Id":3},"SourceContext":"Microsoft.AspNetCore.Mvc.Internal.ControllerActionInvoker","ActionId":"30d05698-d8d9-4bca-86c1-dbc4168bd47f","ActionName":"AspNetCoreAppLogging.Controllers.ValuesController.Get (AspNetCoreAppLogging)","RequestId":"0HLODRKJF5Q7Q:00000001","RequestPath":"/api/values/1","CorrelationId":null,"ConnectionId":"0HLODRKJF5Q7Q"}}
{"@timestamp":"2019-07-21T16:12:59.0520079+03:00","level":"Information","messageTemplate":"Executing action method {ActionName} - Validation state: {ValidationState}","message":"Executing action method \"AspNetCoreAppLogging.Controllers.ValuesController.Get (AspNetCoreAppLogging)\" - Validation state: Valid","fields":{"ActionName":"AspNetCoreAppLogging.Controllers.ValuesController.Get (AspNetCoreAppLogging)","ValidationState":"Valid","EventId":{"Id":1},"SourceContext":"Microsoft.AspNetCore.Mvc.Internal.ControllerActionInvoker","ActionId":"30d05698-d8d9-4bca-86c1-dbc4168bd47f","RequestId":"0HLODRKJF5Q7Q:00000001","RequestPath":"/api/values/1","CorrelationId":null,"ConnectionId":"0HLODRKJF5Q7Q"}}
{"@timestamp":"2019-07-21T16:12:59.0545490+03:00","level":"Information","messageTemplate":"Id value is {@id}","message":"Id value is 1","fields":{"id":1,"SourceContext":"AspNetCoreAppLogging.Controllers.ValuesController","ActionId":"30d05698-d8d9-4bca-86c1-dbc4168bd47f","ActionName":"AspNetCoreAppLogging.Controllers.ValuesController.Get (AspNetCoreAppLogging)","RequestId":"0HLODRKJF5Q7Q:00000001","RequestPath":"/api/values/1","CorrelationId":null,"ConnectionId":"0HLODRKJF5Q7Q"}}
{"@timestamp":"2019-07-21T16:12:59.0546965+03:00","level":"Information","messageTemplate":"CurrentDate {@currentDate}","message":"CurrentDate 07/21/2019 16:12:59","fields":{"currentDate":"2019-07-21T16:12:59.0539674+03:00","SourceContext":"AspNetCoreAppLogging.Controllers.ValuesController","ActionId":"30d05698-d8d9-4bca-86c1-dbc4168bd47f","ActionName":"AspNetCoreAppLogging.Controllers.ValuesController.Get (AspNetCoreAppLogging)","RequestId":"0HLODRKJF5Q7Q:00000001","RequestPath":"/api/values/1","CorrelationId":null,"ConnectionId":"0HLODRKJF5Q7Q"}}
{"@timestamp":"2019-07-21T16:12:59.0632444+03:00","level":"Information","messageTemplate":"Executed action method {ActionName}, returned result {ActionResult} in {ElapsedMilliseconds}ms.","message":"Executed action method \"AspNetCoreAppLogging.Controllers.ValuesController.Get (AspNetCoreAppLogging)\", returned result \"Microsoft.AspNetCore.Mvc.ObjectResult\" in 7.3826ms.","fields":{"ActionName":"AspNetCoreAppLogging.Controllers.ValuesController.Get (AspNetCoreAppLogging)","ActionResult":"Microsoft.AspNetCore.Mvc.ObjectResult","ElapsedMilliseconds":7.3826,"EventId":{"Id":2},"SourceContext":"Microsoft.AspNetCore.Mvc.Internal.ControllerActionInvoker","ActionId":"30d05698-d8d9-4bca-86c1-dbc4168bd47f","RequestId":"0HLODRKJF5Q7Q:00000001","RequestPath":"/api/values/1","CorrelationId":null,"ConnectionId":"0HLODRKJF5Q7Q"}}
{"@timestamp":"2019-07-21T16:12:59.0780298+03:00","level":"Information","messageTemplate":"Executing ObjectResult, writing value of type '{Type}'.","message":"Executing ObjectResult, writing value of type '\"System.String\"'.","fields":{"Type":"System.String","EventId":{"Id":1},"SourceContext":"Microsoft.AspNetCore.Mvc.Infrastructure.ObjectResultExecutor","ActionId":"30d05698-d8d9-4bca-86c1-dbc4168bd47f","ActionName":"AspNetCoreAppLogging.Controllers.ValuesController.Get (AspNetCoreAppLogging)","RequestId":"0HLODRKJF5Q7Q:00000001","RequestPath":"/api/values/1","CorrelationId":null,"ConnectionId":"0HLODRKJF5Q7Q"}}
{"@timestamp":"2019-07-21T16:12:59.1891160+03:00","level":"Information","messageTemplate":"Executed action {ActionName} in {ElapsedMilliseconds}ms","message":"Executed action \"AspNetCoreAppLogging.Controllers.ValuesController.Get (AspNetCoreAppLogging)\" in 178.787ms","fields":{"ActionName":"AspNetCoreAppLogging.Controllers.ValuesController.Get (AspNetCoreAppLogging)","ElapsedMilliseconds":178.787,"EventId":{"Id":2},"SourceContext":"Microsoft.AspNetCore.Mvc.Internal.ControllerActionInvoker","ActionId":"30d05698-d8d9-4bca-86c1-dbc4168bd47f","RequestId":"0HLODRKJF5Q7Q:00000001","RequestPath":"/api/values/1","CorrelationId":null,"ConnectionId":"0HLODRKJF5Q7Q"}}
{"@timestamp":"2019-07-21T16:12:59.1894328+03:00","level":"Information","messageTemplate":"Executed endpoint '{EndpointName}'","message":"Executed endpoint '\"AspNetCoreAppLogging.Controllers.ValuesController.Get (AspNetCoreAppLogging)\"'","fields":{"EndpointName":"AspNetCoreAppLogging.Controllers.ValuesController.Get (AspNetCoreAppLogging)","EventId":{"Id":1,"Name":"ExecutedEndpoint"},"SourceContext":"Microsoft.AspNetCore.Routing.EndpointMiddleware","RequestId":"0HLODRKJF5Q7Q:00000001","RequestPath":"/api/values/1","CorrelationId":null,"ConnectionId":"0HLODRKJF5Q7Q"}}
{"@timestamp":"2019-07-21T16:12:59.1930508+03:00","level":"Information","messageTemplate":"{HostingRequestFinishedLog:l}","message":"Request finished in 250.0832ms 200 application/json; charset=utf-8","fields":{"ElapsedMilliseconds":250.0832,"StatusCode":200,"ContentType":"application/json; charset=utf-8","HostingRequestFinishedLog":"Request finished in 250.0832ms 200 application/json; charset=utf-8","EventId":{"Id":2},"SourceContext":"Microsoft.AspNetCore.Hosting.Internal.WebHost","RequestId":"0HLODRKJF5Q7Q:00000001","RequestPath":"/api/values/1","CorrelationId":null,"ConnectionId":"0HLODRKJF5Q7Q"},"renderings":{"HostingRequestFinishedLog":[{"Format":"l","Rendering":"Request finished in 250.0832ms 200 application/json; charset=utf-8"}]}}
Fluentd
This tool will be responsible for collecting logs from our container output and sending them to Elasticsearch. We’ll run fluentd in a container too, so let’s add a fluentd directory to our solution. We place a Docker file and a file with configuration inside it.
FROM fluent/fluentd:latest
RUN ["gem", "install", "fluent-plugin-elasticsearch", "--no-rdoc", "--no-ri"]
<source>
  @type forward
  host fluentd
  port 24224
  bind 0.0.0.0
  tag docker
</source>
<filter httpd.access>
  @type parser
  format json
  key_name log
  reserve_data false
</filter>
<match httpd.access>
  @type copy
  <store>
    @type elasticsearch
    hosts elasticsearch:9200
    logstash_format true
    logstash_prefix applogging
    logstash_dateformat %Y.%m.%d
    include_tag_key true
    type_name applogging_log
    tag_key @log_name
    flush_interval 1s
  </store>
  <store>
    @type stdout
  </store>
</match>
As you can see, we install this plugin to our fluentd container, which directs logs to Elasticsearch. Do bear in mind that it is a general configuration, you may want to optimize it more for your purposes. Here you can find details for the fluentd and here for the plugin.
Run the service
Now we’re ready to run our service with the logging system. I prepared a docker-compose file.
version: '3.4'

services:
  api:
    build: .
    container_name: api
    ports:
      - "8000:80"
    environment:
      ASPNETCORE_ENVIRONMENT: Docker
    logging:
      driver: "fluentd"
      options:
        fluentd-address: localhost:24224
        tag: httpd.access
    depends_on:
      - fluentd

  fluentd:
    build: ./fluentd
    container_name: fluentd
    ports:
      - 24224:24224
    volumes:
      - ./fluentd/conf:/fluentd/etc
    depends_on:
      - elasticsearch
      - kibana

  elasticsearch:
    image: docker.elastic.co/elasticsearch/elasticsearch:6.6.1
    environment:
      - discovery.type=single-node
    ports:
      - 9200:9200

  kibana:
    depends_on:
      - elasticsearch
    image: docker.elastic.co/kibana/kibana:6.6.1
    environment:
      ELASTICSEARCH_URL: http://elasticsearch:9200
    ports:
    - 5601:5601
Our service has a logging section. This mechanism delivers log messages from our container to fluentd logging driver. Here you can find documentation for the docker logging drivers.
Add this file to your solution directory and run it with a command docker-compose up -d --build.
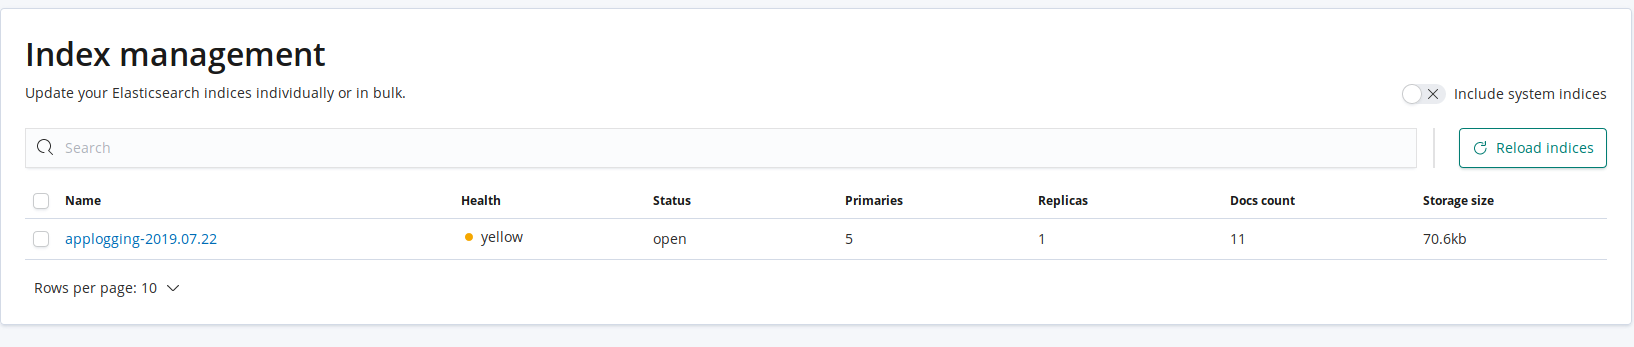
Create some requests, and you’ll see a new index with our logs in the Elasticsearch (http://localhost:9200/_cat/indices). Note that all our indexes will have postfix with a date (we set up index name in the config file with a logstash_prefix and logstash_dateformat parameters).

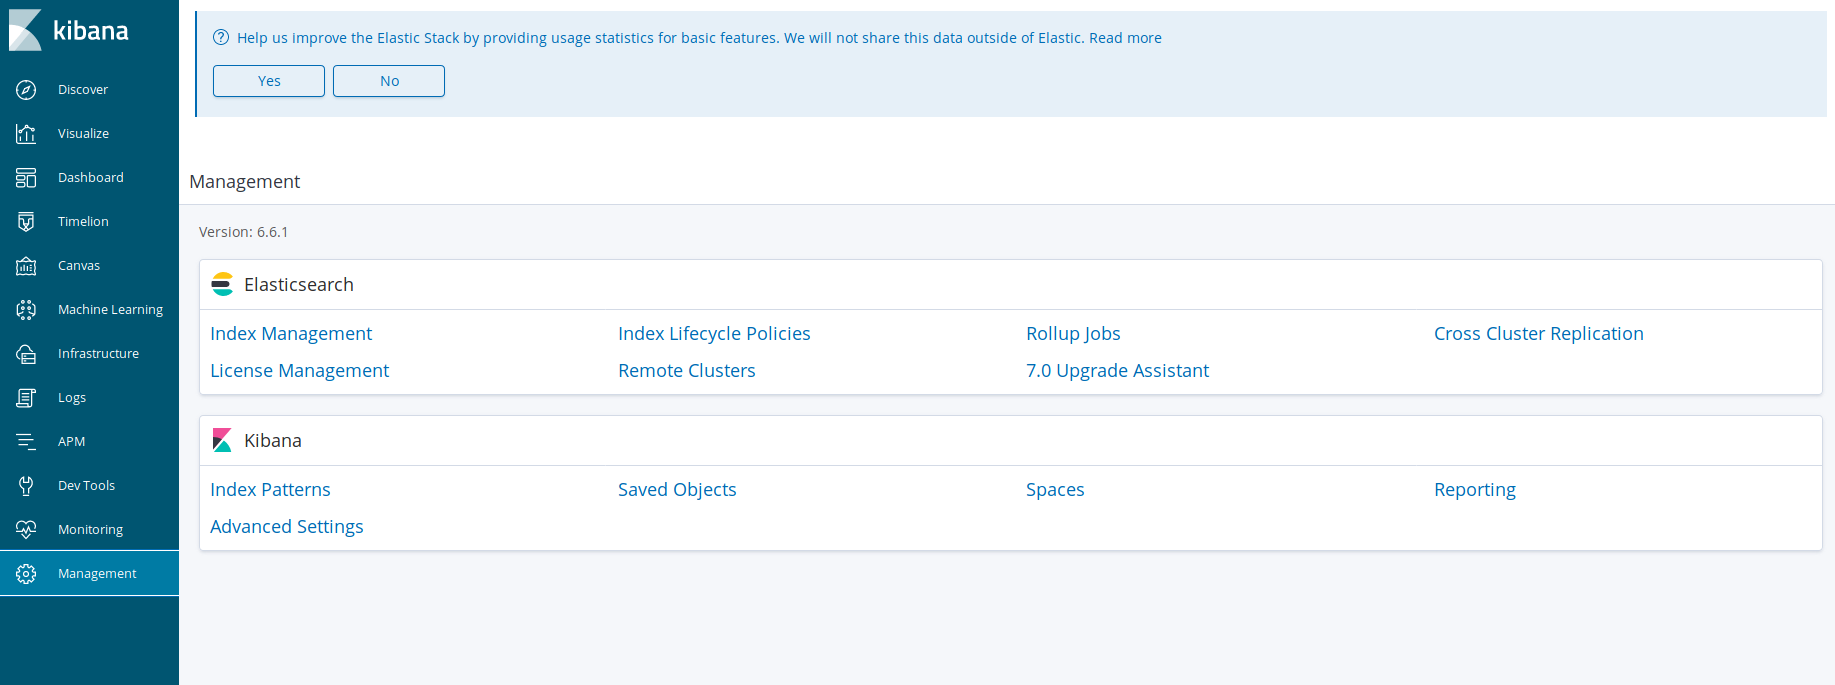
Now let’s go to Kibana (http://localhost:5601 -> Management -> Elasticsearch -> Index Management). You’ll see the same index there.
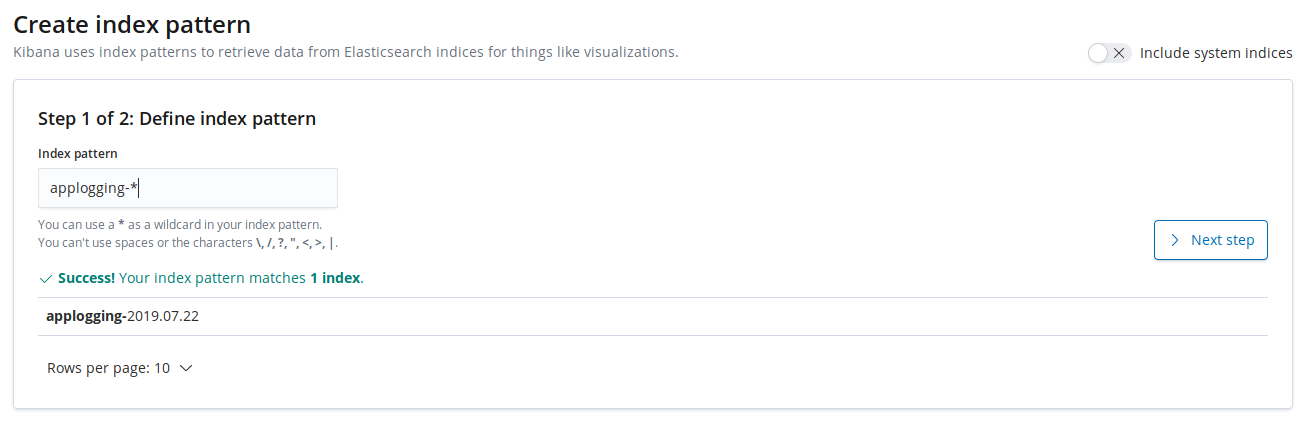
After that, we’ll add this index to Kibana dashboard. Go to Management -> Kibana -> Index Patterns and specify the index prefix (applogging-* in our case).
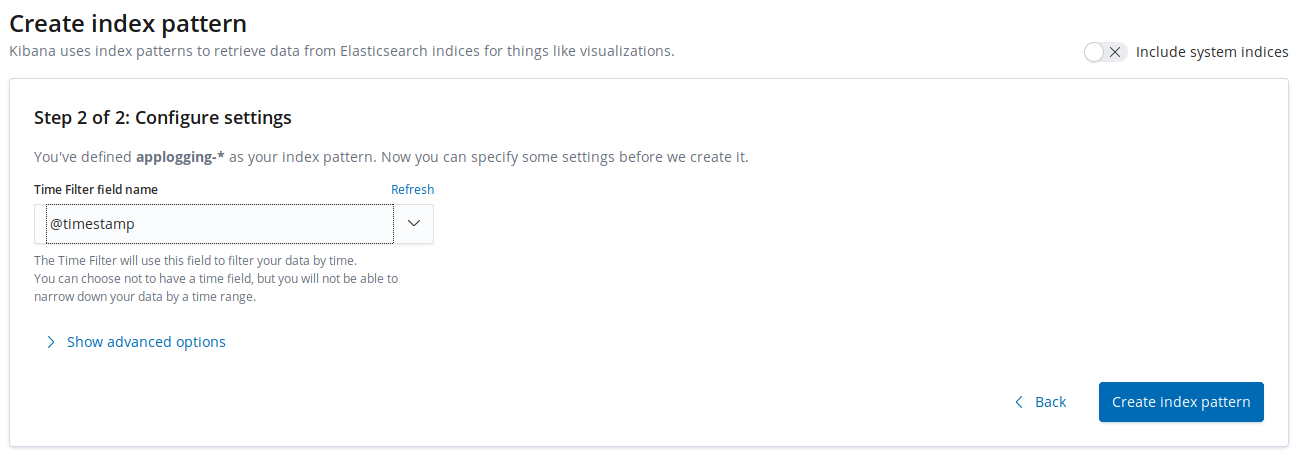
In the next step define @timestamp as a time filter field name.
And now in the Overview section, you can see a graph of your logs.
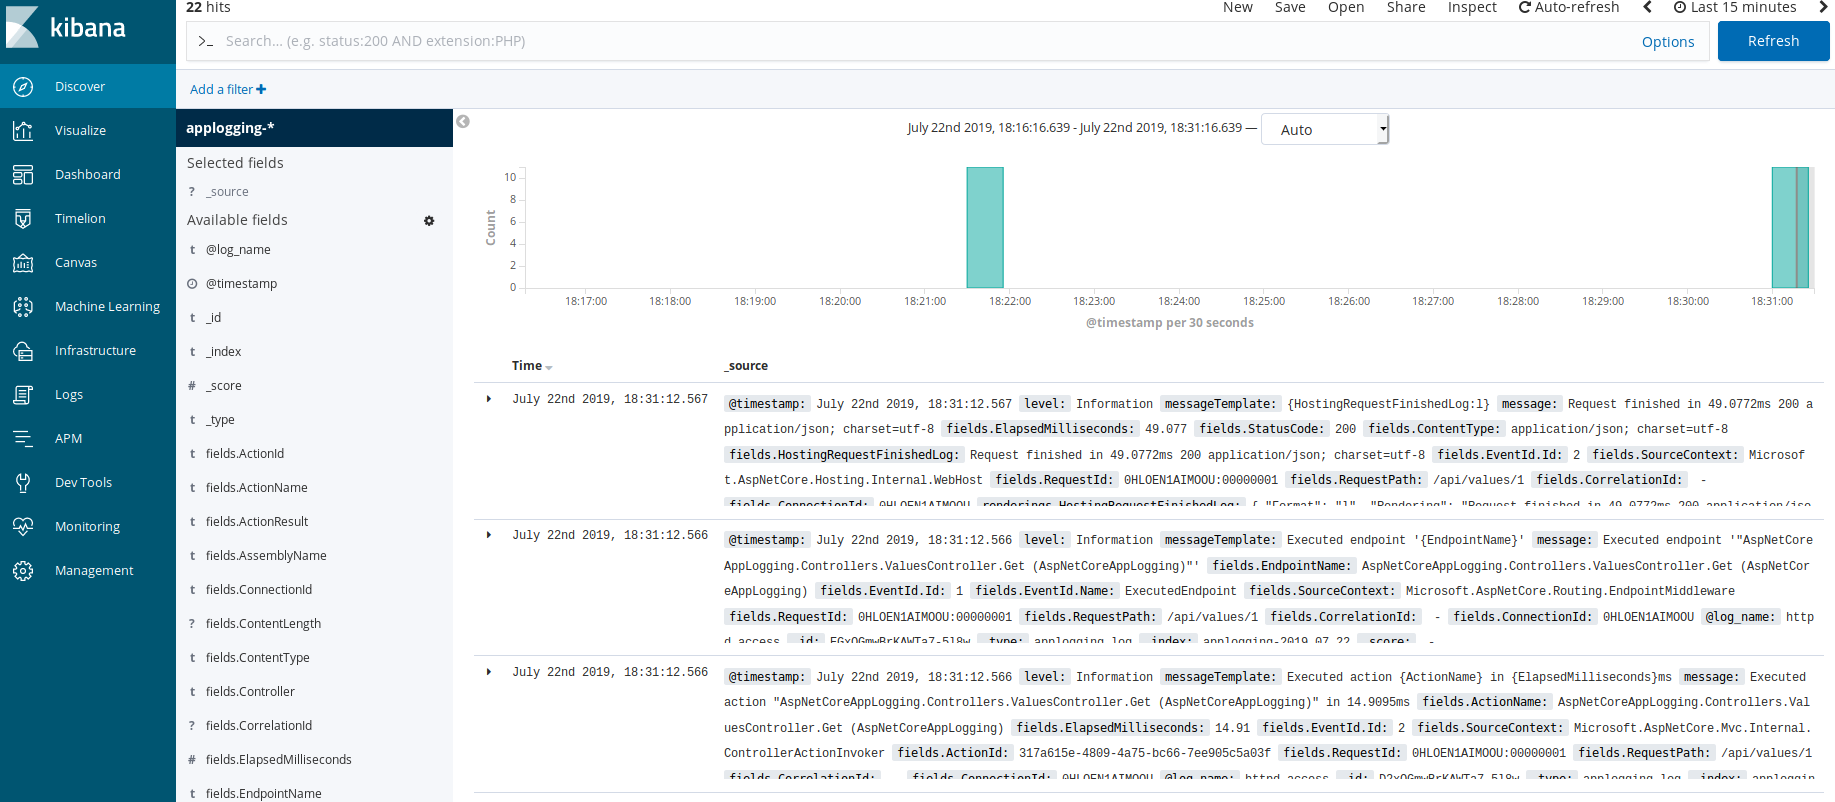
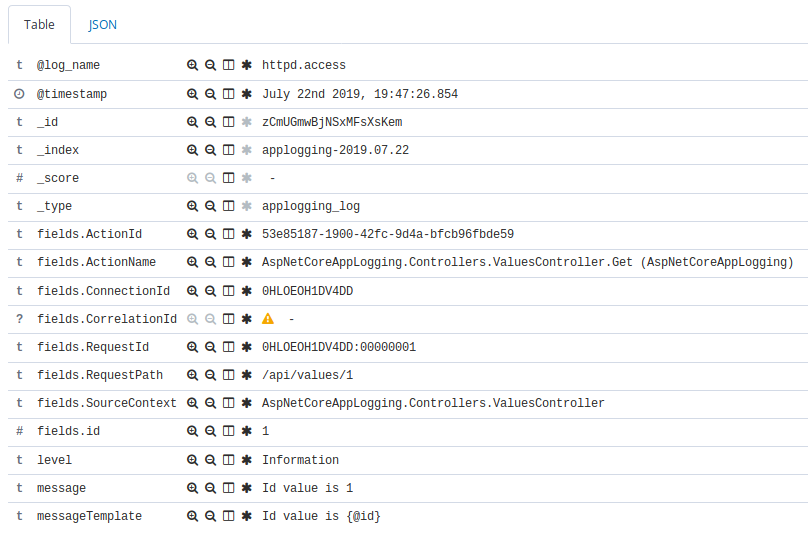
Every entry has details. Also, you can see the fields that we save in our application (@id field, for example).
Kibana allows you to create different types of search, build various graphs and dashboards. It’s a very powerful tool, so we won’t discuss here all its capabilities.
Conclusion
Today we’ve exported our logs to an ELK system which is great for searching and visualizing. It is definitely more convenient and productive to work with your logs in such system rather than deals with files or console output. Also, as you saw, it’s very simple to connect ELK with our application with the help of Serilog. We just need to edit the config file.
Image: Photo by Ales Krivec on Unsplash
Comments