Tracing for messaging application

Tracing can be very powerful to debug problems in production. I won’t go deeper into the tracing details today, but I want to demonstrate one particular issue I encountered during development.
As I mentioned in the introduction, I’m going to discuss the dotnet-trace tool and MassTransit library. The tool allows you to capture events from the application. This process is very similar to logging. Framework and many libraries write useful information with these events, and you can catch them and analyse the application’s problems. MassTransit indeed writes some diagnostic events, but there is one problem.
DiagnosticSource and EventSource
There are two main classes to send traces System.Diagnostics.DiagnosticSource and System.Diagnostics.Tracing.EventSource. The first one is used for logging data within the process, so it allows non-serializable types. The second one, on the opposite, assumes that the events will leave the process and requires only serialisable data. As you may see, the EventSource class produces events that can be consumed via the dotnet-trace tool. The main problem is that MassTransit uses DiagnosticSource.
How can we deal with that?
There is one solution called DiagnosticSourceEventSource. It is a bridge between DiagnosticSource and EventSource. With its help, we can consume events via the tracing tool from any DiagnosticSource.
Let’s start our project. I’m using the async-request-processing application from the previous posts.
$ dotnet run
Now, we need to specify the provider for dotnet-trace collect command as Microsoft-Diagnostics-DiagnosticSource and an argument FilterAndPayloadSpecs. The argument contains an interested DiagnosticSource. Also, it may provide an event name, a list of transformations, etc. You can find the entire structure of the argument in the source code.
$ dotnet-trace collect --process-id 184530 --providers=Microsoft-Diagnostics-DiagnosticSource:3:5:FilterAndPayloadSpecs=MassTransit
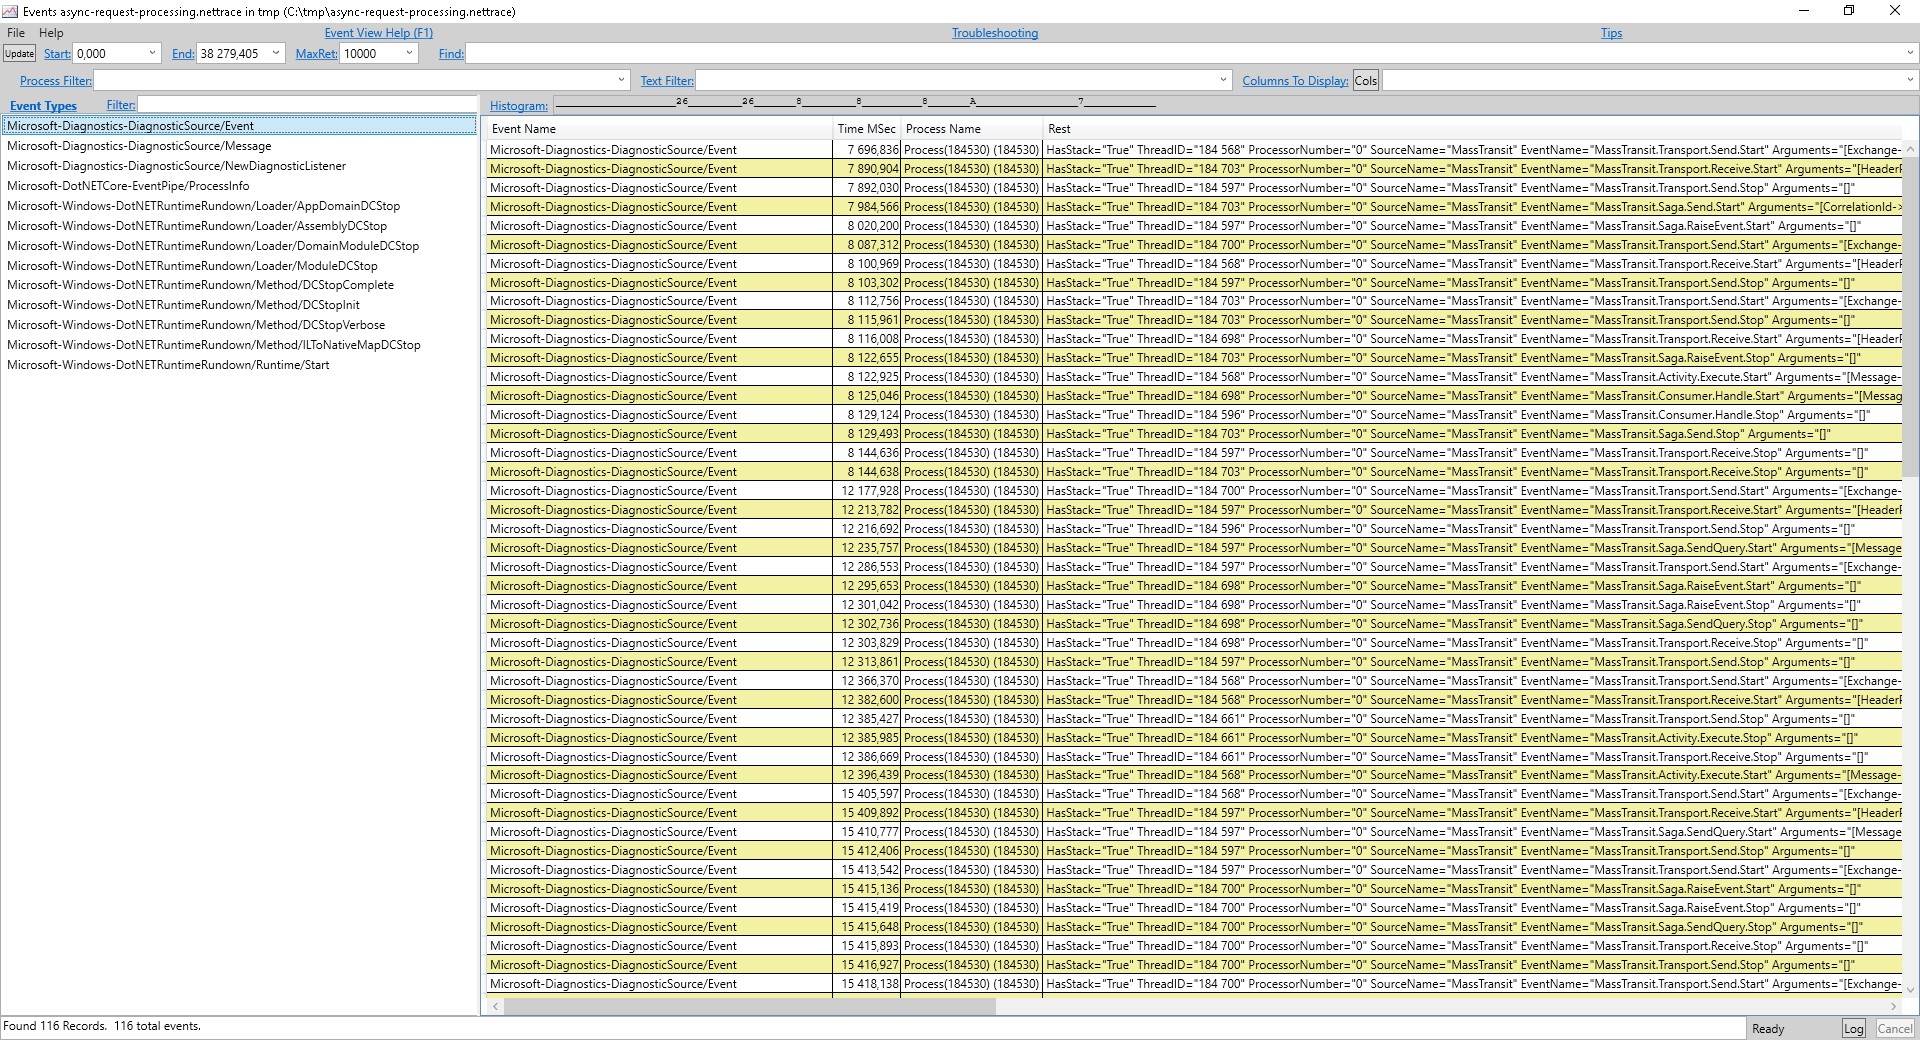
Finally, open the result in PerfView. The events are available for analysis.
Conclusion
In this short post, I’ve briefly touched on tracing and showed how to consume events with the dotnet-trace tool from DiagnosticSource class.
References
- Conversation about diagnostics
- dotnet-trace performance analysis utility
- DiagnosticSource User’s Guide
- DiagnosticSourceEventSource
- MassTransit DiagnosticSource
- .NET Core logging and tracing
Image: Photo by Anne Nygård on Unsplash
Comments