Distributed tracing for messaging application

Distributed Tracing
It is a technique to profile and monitor your application, especially if it has multiple parts. One of the complexities in a distributed architecture, for example, in the microservices world, is that you have a lot of services, they’re calling each other. Therefore, if you have a bug or a long response, it’s tricky to find the source of the problem. Sometimes, you don’t even know which services in your system are connected. So, distributed tracing is essential for modern web applications as well as logs or metrics.
Sometimes ago, you may have heard the news about adding the support for distributed tracing in ASP. NET Core. Today, it’s effortless to include it into your application if you’re using HTTP requests. Things become interesting if your services are connected via messages. In this post, I want to show you how to add support for 3rd party messaging library to produce distributed traces.
Before we start, I need to mention that there is a library for MassTransit (and some other tools) which does what we want, but for educational purposes, let’s do it all by ourselves 😉.
Getting started
To start with, create simple api and worker projects. I won’t go deep into configuring simple messaging communication via MassTransit because I have multiple posts about it (for example, Distributed application with Project Tye) or check out the documentation. The source code you can find in my repository.
public class Program
{
    public static void Main(string[] args)
    {
        CreateHostBuilder(args).Build().Run();
    }

    public static IHostBuilder CreateHostBuilder(string[] args) =>
        Host.CreateDefaultBuilder(args)
            .ConfigureWebHostDefaults(webBuilder =>
            {
                webBuilder.ConfigureServices(services =>
                {
                    services.AddControllers();
                    services.AddMassTransit(x =>
                        {
                            x.SetKebabCaseEndpointNameFormatter();
                            x.UsingRabbitMq();
                            x.AddRequestClient<GreetingRequest>();
                        })
                        .AddMassTransitHostedService();
                });
                webBuilder.Configure(builder =>
                {
                    builder.UseRouting();
                    builder.UseEndpoints(endpoints => { endpoints.MapControllers(); });
                });
            });
}
[ApiController]
[Route("[controller]")]
public class GreetingController : ControllerBase
{
    private readonly IRequestClient<GreetingRequest> _client;

    public GreetingController(IRequestClient<GreetingRequest> client)
    {
        _client = client;
    }

    [HttpGet]
    [Route("{name}")]
    public async Task<IActionResult> GetGreeting(string name)
    {
        var response = await _client.GetResponse<GreetingResponse>(new GreetingRequest(name));
        return Ok(response.Message.Greeting);
    }
}
GreetingController accepts a request and sends its own request to the consumer.
public class Program
{
    public static void Main(string[] args)
    {
        CreateHostBuilder(args).Build().Run();
    }

    public static IHostBuilder CreateHostBuilder(string[] args) =>
        Host.CreateDefaultBuilder(args)
            .ConfigureServices((_, services) =>
            {
                services.AddMassTransit(x =>
                    {
                        x.SetKebabCaseEndpointNameFormatter();
                        x.UsingRabbitMq((context, cfg) =>
                        {
                            cfg.ConfigureEndpoints(context);
                        });
                        x.AddConsumer<GreetingConsumer>();
                    })
                    .AddMassTransitHostedService();
            });
}
public class GreetingConsumer : IConsumer<GreetingRequest>
{
    public async Task Consume(ConsumeContext<GreetingRequest> context)
    {
        await context.RespondAsync(new GreetingResponse($"Hello, {context.Message.Name}!"));
    }
}
GreetingConsumer consume the request from the api project and sends back a response. As I said, very basic application. Also, you need to add a RabbitMQ in the docker-compose script.
version: "3.3"
services:
  rabbitmq:
    container_name: rabbitmq
    image: rabbitmq:3-management
    ports:
      - "5672:5672"
      - "15672:15672"
Now, we’re ready to test our app.
GET http://localhost:5000/greeting/rafaelldi
Content-Type: application/json

HTTP/1.1 200 OK
Content-Type: text/plain; charset=utf-8
Server: Kestrel
Transfer-Encoding: chunked

Hello, rafaelldi!

Response code: 200 (OK); Time: 1238ms; Content length: 17 bytes
Everything is working as expected; let’s go towards distributed tracing.
Initial Distributed Tracing
First of all, we have to install OpenTelemetry, OpenTelemetry.Instrumentation.AspNetCore, OpenTelemetry.Extensions.Hosting, OpenTelemetry.Exporter.Jaeger nuget-packages to our projects.
Add some code to the api project.
services.AddOpenTelemetryTracing(x => x
    .SetResourceBuilder(ResourceBuilder.CreateDefault().AddService("api"))
    .AddAspNetCoreInstrumentation()
    .AddJaegerExporter());
And to the worker project.
services.AddOpenTelemetryTracing(x => x
    .SetResourceBuilder(ResourceBuilder.CreateDefault().AddService("worker"))
    .AddJaegerExporter());
Finally, add Jaeger to the docker-compose script. This service will collect our traces.
jaeger:
  container_name: jaeger
  image: jaegertracing/all-in-one
  ports:
    - "5775:5775/udp"
    - "5778:5778"
    - "6831:6831/udp"
    - "6832:6832/udp"
    - "9411:9411"
    - "14250:14250"
    - "14268:14268"
    - "16686:16686"
Now, make another call to the controller and go to the http://localhost:16686/search page.
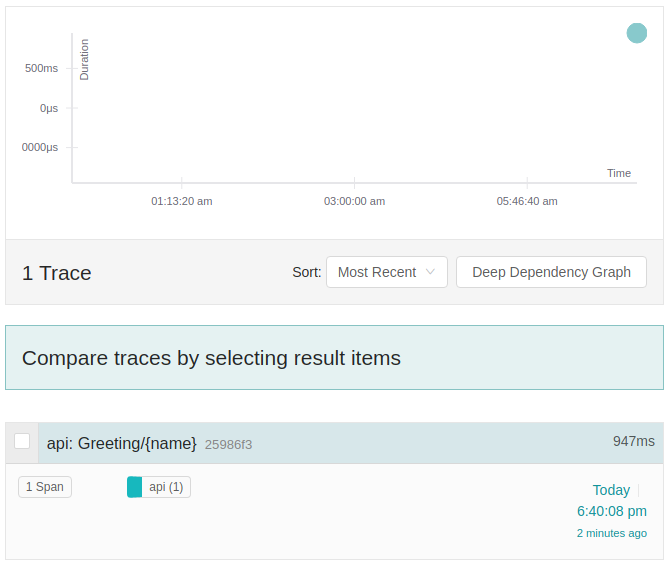
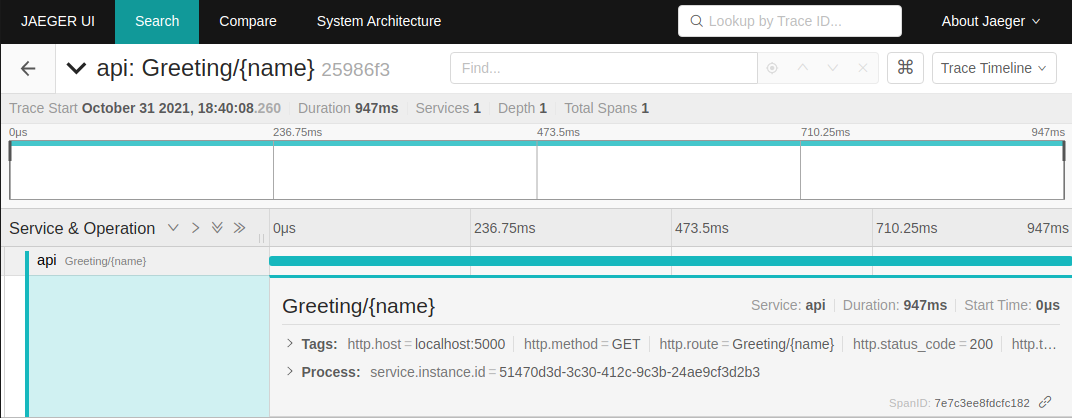
You will see a trace with a single span (only from GreetingController). So the rest is up to us to implement on our own.
Filters
The first idea is to accomplish this behaviour via MassTransit filters. They will be responsible for producing spans. Also, with their help, we’ll insert some value into the message’s headers and retrieve it back on the consumer side to connect different parts of our application.
To instrument our code, we should start with a new ActivitySource.
public static class MassTransitInstrumentationActivitySource
{
    public const string ActivitySourceName = "MassTransitInstrumentation";
    public static readonly ActivitySource Source = new(ActivitySourceName);
}
Next, we’ll need three types of filters.
public class SendActivityFilter<T> : IFilter<SendContext<T>> where T : class
{
    public Task Send(SendContext<T> context, IPipe<SendContext<T>> next)
    {
        using var activity = MassTransitInstrumentationActivitySource.Source.StartActivity("send", ActivityKind.Producer);

        activity?.SetTag("messaging.system", "rabbitmq");

        context.Headers.Set(Headers.TraceParent, activity?.Id);

        return next.Send(context);
    }

    public void Probe(ProbeContext context)
    {
        context.CreateFilterScope("Send activity");
    }
}
public class PublishActivityFilter<T> : IFilter<PublishContext<T>> where T : class
{
    public Task Send(PublishContext<T> context, IPipe<PublishContext<T>> next)
    {
        using var activity = MassTransitInstrumentationActivitySource.Source.StartActivity("send", ActivityKind.Producer);

        activity?.SetTag("messaging.system", "rabbitmq");

        context.Headers.Set(Headers.TraceParent, activity?.Id);

        return next.Send(context);
    }

    public void Probe(ProbeContext context)
    {
        context.CreateFilterScope("Publish activity");
    }
}
public class ConsumeActivityFilter<T> : IFilter<ConsumeContext<T>> where T : class
{
    public Task Send(ConsumeContext<T> context, IPipe<ConsumeContext<T>> next)
    {
        using var activity = context.Headers.TryGetHeader(Headers.TraceParent, out var parentId)
            ? MassTransitInstrumentationActivitySource.Source.StartActivity("receive", ActivityKind.Consumer, (string)parentId)
            : MassTransitInstrumentationActivitySource.Source.StartActivity("receive", ActivityKind.Consumer);

        activity?.SetTag("messaging.system", "rabbitmq");
        activity?.SetTag("messaging.operation", "receive");

        return next.Send(context);
    }

    public void Probe(ProbeContext context)
    {
        context.CreateFilterScope("Consume activity");
    }
}
public static class Headers
{
    public const string TraceParent = "traceparent";
}
As you can see, they create a new activity from our ActivitySource, set a new header with a value of the current activity id (SendActivityFilter and PublishActivityFilter) or use this header to create a new activity (ConsumeActivityFilter). It sets a parent for the created activity and combines them into a kind of chain. It’ll be more apparent when we’ll check out our trace in Jaeger. Also, I’ve added some additional tags. This information may be convenient for diagnostics. The full specification you can find here.
Lastly, we need to register our new components.
services.AddOpenTelemetryTracing(x => x
    ...
    .AddSource(MassTransitInstrumentationActivitySource.ActivitySourceName)
    ...
services.AddMassTransit(x =>
    {
        ...
        x.UsingRabbitMq((context, cfg) =>
        {
            cfg.UsePublishFilter(typeof(PublishActivityFilter<>), context);
        });
        ...
    })
services.AddMassTransit(x =>
    {
        ...
        x.UsingRabbitMq((context, cfg) =>
        {
            cfg.UseSendFilter(typeof(SendActivityFilter<>), context);
            cfg.UseConsumeFilter(typeof(ConsumeActivityFilter<>), context);
            cfg.ConfigureEndpoints(context);
        });
        ...
    })
Send a new request and look at Jaeger dashboard.
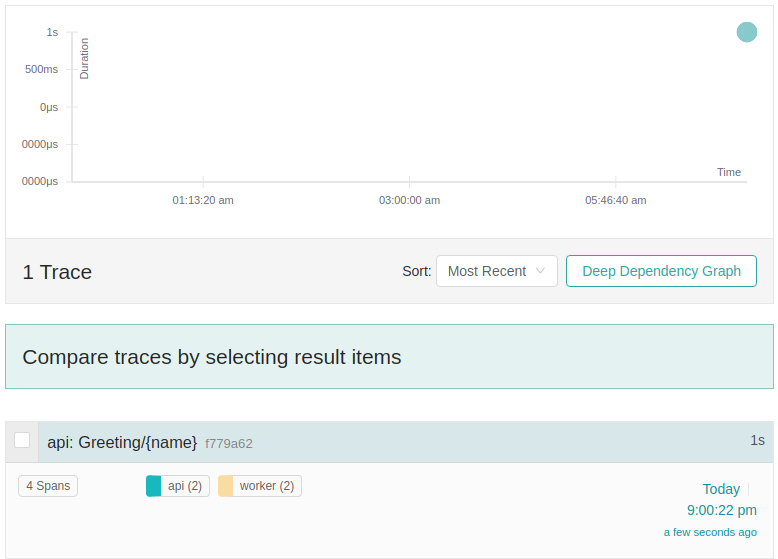
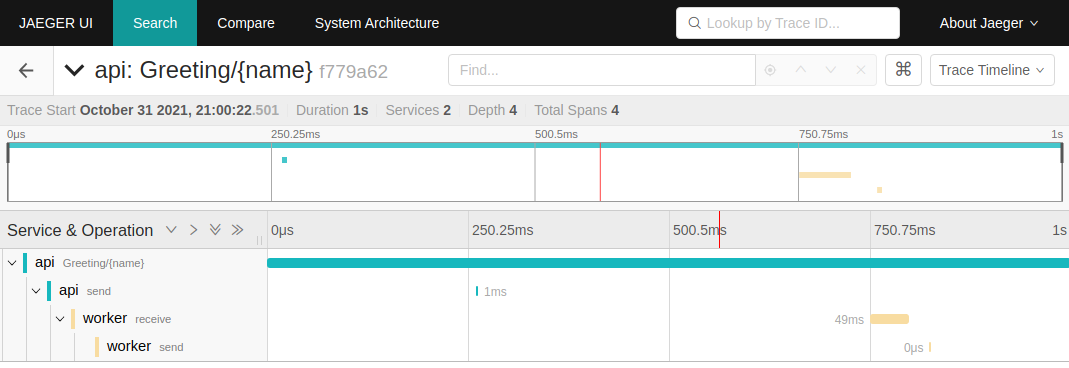
As we expected, now we have spans from both our projects, and they form a sequence of calls. You can easily understand where the request starts and finishes, see the duration of each operation. But it’s not convenient to write a filter for each action and do not forget to register them. Sometimes this is the only option. But with MassTransit, we can do better.
Diagnostic Source
If you remember my previous post, you know that MassTransit emits some diagnostic events with its DiagnosticSource. It appears that MassTransit uses the same Activity class for this purpose but creates them directly via the constructor rather than from ActivitySource. These activities are called “legacy Activities”, and there is a particular method to register them. Now, let’s modify our projects to include relevant events.
services.AddOpenTelemetryTracing(x => x
    ...
    .AddLegacySource("MassTransit.Consumer.Consume")
    .AddLegacySource("MassTransit.Transport.Send")
    .AddLegacySource("MassTransit.Transport.Receive")
    .AddLegacySource("MassTransit.Consumer.Handle")
    ...
After these changes, you won’t see any differences, because for now, events are unavailable. To activate them, we have to subscribe to the DiagnosticSource. It’s an optimization that without any subscription, this source doesn’t produce events. I’ve created a simple hosted service to add a new subscription.
public class MassTransitDiagnosticsHostedService : IHostedService
{
    private IDisposable _subscription;
    private IDisposable _massTransitSubscription;

    public Task StartAsync(CancellationToken cancellationToken)
    {
        _subscription ??= DiagnosticListener.AllListeners.Subscribe(delegate(DiagnosticListener listener)
        {
            if (listener.Name == "MassTransit")
            {
                _massTransitSubscription ??= listener.Subscribe();
            }
        });
        return Task.CompletedTask;
    }

    public Task StopAsync(CancellationToken cancellationToken)
    {
        _massTransitSubscription?.Dispose();
        _subscription?.Dispose();
        return Task.CompletedTask;
    }
}
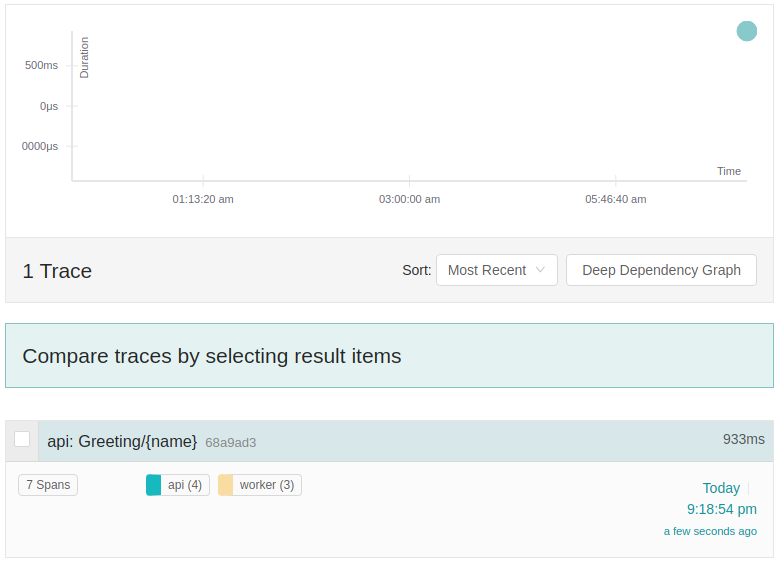
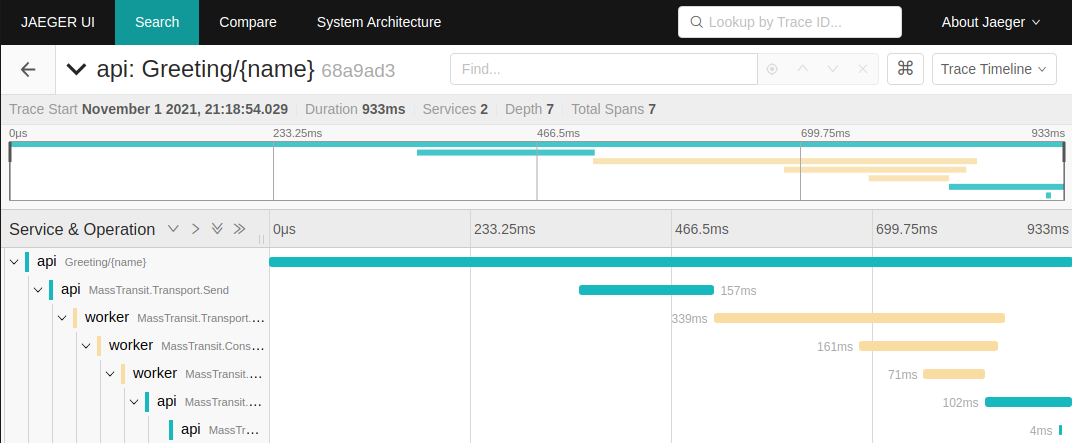
Eventually, you’ll see new spans in the Jaeger.
Conclusion
In this post, I’ve talked about distributed tracing and shown some techniques to add traces from an external library. Traces must spread across all your code to be effective. So, if your favourite library doesn’t support tracing, it’s not so hard to do it by yourself.
References
The source code is available here
- Adding distributed tracing instrumentation
- OpenTelemetry .NET
- OpenTelemetry .NET API
- Extending the OpenTelemetry .NET SDK
- OpenTelemetry - Messaging systems
- MassTransit DiagnosticSource
- DiagnosticSource User’s Guide
- MassTransit Instrumentation for OpenTelemetry .NET
Image: Photo by p j on Unsplash
Comments