This post is more of a practical example of my previous one about traces. Let’s look at where you can use them in your real-world projects and what superpowers they can give you.
EF Core
I’ll start with EF Core because it’s easier to use tracing with it. Let’s create a new application with EF Core just to test our trace scenarios. It doesn’t really matter what the code does. These tools can also be used for large-scale projects.
As I showed in my previous post, to consume traces from the same process, you need to create two observers.
public class AllDiagnosticListenerObserver : IObserver<DiagnosticListener>
{
    public void OnCompleted()
    {
    }

    public void OnError(Exception error)
    {
    }

    public void OnNext(DiagnosticListener listener)
    {
        if (listener.Name == DbLoggerCategory.Name /*"Microsoft.EntityFrameworkCore"*/)
        {
            listener.Subscribe(new EfCoreObserver());
        }
    }
}
Here you can see that EF Core has a great diagnostic API because you can use predefined constants (
e.g. DbLoggerCategory.Name), strongly typed objects and
the documentation can help
you a lot.
Then, subscribe this listener.
DiagnosticListener.AllListeners.Subscribe(new AllDiagnosticListenerObserver());
Finally, let’s add our custom observer and see what we can get from it.
public class EfCoreObserver : IObserver<KeyValuePair<string, object?>>
{
    public void OnCompleted()
    {
    }

    public void OnError(Exception error)
    {
    }

    public void OnNext(KeyValuePair<string, object?> pair)
    {
        //...
    }
}
You can then
use CoreEventId,
RelationalEventId
or some provider-specific custom events (
e.g. SqlServerEventId).
Just check the documentation, it contains a good description of each event and the fields that can be observed in the
event.
For
example, RelationalEventId.CommandExecuted.
From this
event, you can retrieve
the command that was executed, or the duration of the execution, or the result of the execution. Then analyse them in
some way and send alerts or something. Or you could connect to a running server and check the exact query it sends to
the database for a particular web request.
if (pair.Key == RelationalEventId.CommandExecuted.Name)
{
    var payload = pair.Value as CommandExecutedEventData;
    var command = payload.Command.CommandText;
    var duration = payload.Duration;
    var result = payload.Result;
    //...
}
Or the next
example RelationalEventId.DataReaderClosing.
From it,
you can see the exact number of read operations that have been performed. Too many for one query? Let’s log the command
itself!
if (pair.Key == RelationalEventId.DataReaderClosing.Name)
{
    var payload = pair.Value as DataReaderClosingEventData;
    var readCount = payload.ReadCount;
    var command = payload.Command.CommandText;
    //...
}
Or CoreEventId.SaveChangesCompleted
to trace the number of saved entities. You can use it to easily spot bugs when a command is executed with the wrong
WHERE clause and updates half of your database.
Or CoreEventId.SaveChangesFailed
to check the cause of failure. Also, there are some warning you can monitor (
e.g CoreEventId.FirstWithoutOrderByAndFilterWarning).
So you can see that tracing gives you access to extremely useful data that can help you create your own monitoring tools
and diagnose problems.
ASP.NET Core
With ASP .NET Core this is not so easy as there are no predefined event names and payload types. How to find what is
available? First of all, you can put a breakpoint on AllDiagnosticListenerObserver and check which listeners are
active in your application. I found that there is one Microsoft.AspNetCore, let’s subscribe to it.
else if (listener.Name == "Microsoft.AspNetCore")
{
    listener.Subscribe(new AspNetCoreObserver());
}
public class AspNetCoreObserver : IObserver<KeyValuePair<string, object?>>
{
    public void OnCompleted()
    {
    }

    public void OnError(Exception error)
    {
    }

    public void OnNext(KeyValuePair<string, object?> pair)
    {
        var key = pair.Key;
    }
}
The next step is to similarly place a breakpoint on the new AspNetCoreObserver class and check event names and their
payloads.
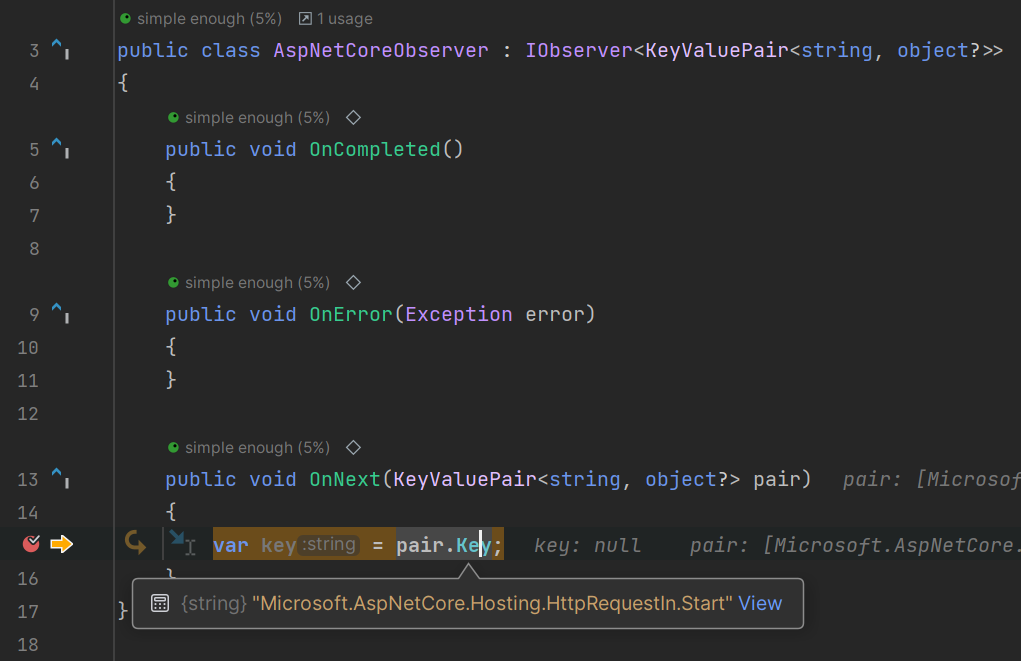
For example, from Microsoft.AspNetCore.Hosting.HttpRequestIn.Start
and Microsoft.AspNetCore.Hosting.HttpRequestIn.Stop you can get DefaultHttpContext and all information about the
request.
if (key == "Microsoft.AspNetCore.Hosting.HttpRequestIn.Start")
{
    var payload = pair.Value as DefaultHttpContext;
    var method = payload.Request.Method;
    var path = payload.Request.Path;
}
else if (key == "Microsoft.AspNetCore.Hosting.HttpRequestIn.Stop")
{
    var payload = pair.Value as DefaultHttpContext;
    var statusCode = payload.Response.StatusCode;
}
Or you can analyse exceptions. I use reflection here because this event has a payload as an anonymous type, and it isn’t possible to just cast it.
else if (key == "Microsoft.AspNetCore.Diagnostics.HandledException")
{
    var exceptionProperty = pair.Value.GetType().GetProperty("exception");
    var exception = exceptionProperty.GetValue(pair.Value) as Exception;
}
Conclusion
In this post, I’ve shown some practical examples of using traces to monitor your application. You can use these observers to constantly analyse events, or you can use a sidecar container to attach and capture events in a test or staging environment. Or you could even have a console application to connect to your application only when you’re investigating some suspicious scenario to see what’s going on inside. I think such a tool can save you a lot of time when debugging a tricky problem.
Comments